Fig. 2
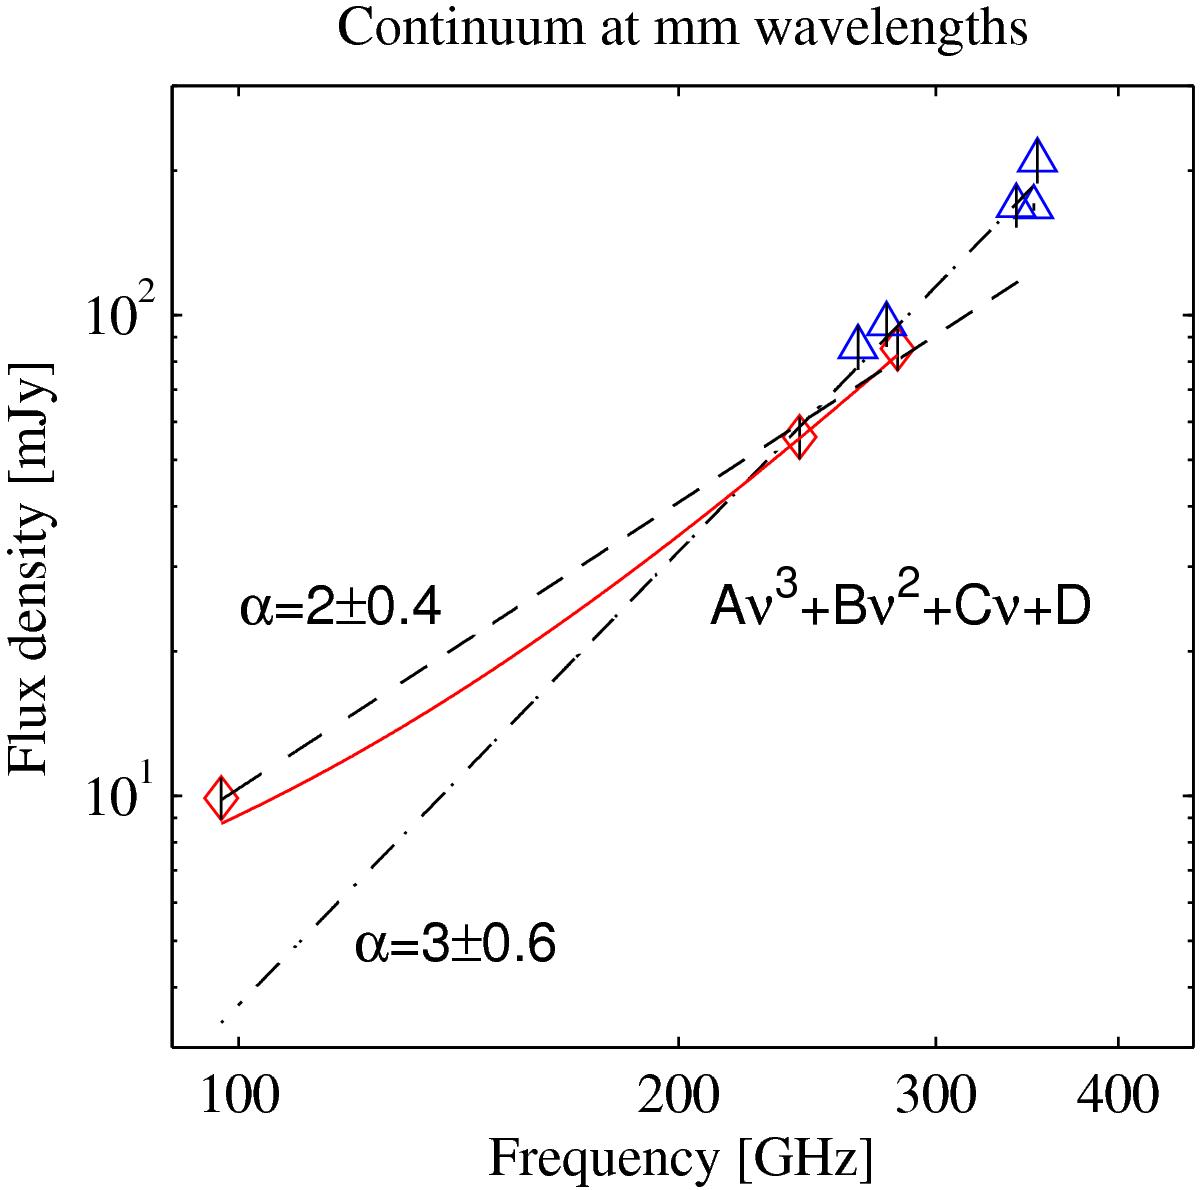
Continuum flux density of NGC 4418 at mm wavelengths. The red diamonds represent the average value of line-free channels in the ALMA bands 3, 6, and 7. Sub-mm continuum levels from Sakamoto et al. (2010) and Sakamoto et al. (2013) are shown as blue triangles. Error bars were calculated as the quadrature sum of the spectrum rms and a calibration uncertainty of 10%. The dot-dashed, and dashed lines represent the power-law fit of data points above 200 GHz (α = 3 ± 0.6) and below 270 GHz (α = 2 ± 0.4), respectively. The red solid line shows the best fit to the ALMA baseline with a third-order polynomial. The best fit parameters are A = 2.7 × 10⁻⁹ Jy/GHz3, B = 6.2 × 10⁻⁸ Jy/GHz2, C = 3.2 × 10⁻⁵ Jy/GHz, D = 2.3 × 10⁻³ Jy.
Current usage metrics show cumulative count of Article Views (full-text article views including HTML views, PDF and ePub downloads, according to the available data) and Abstracts Views on Vision4Press platform.
Data correspond to usage on the plateform after 2015. The current usage metrics is available 48-96 hours after online publication and is updated daily on week days.
Initial download of the metrics may take a while.