Fig. 2
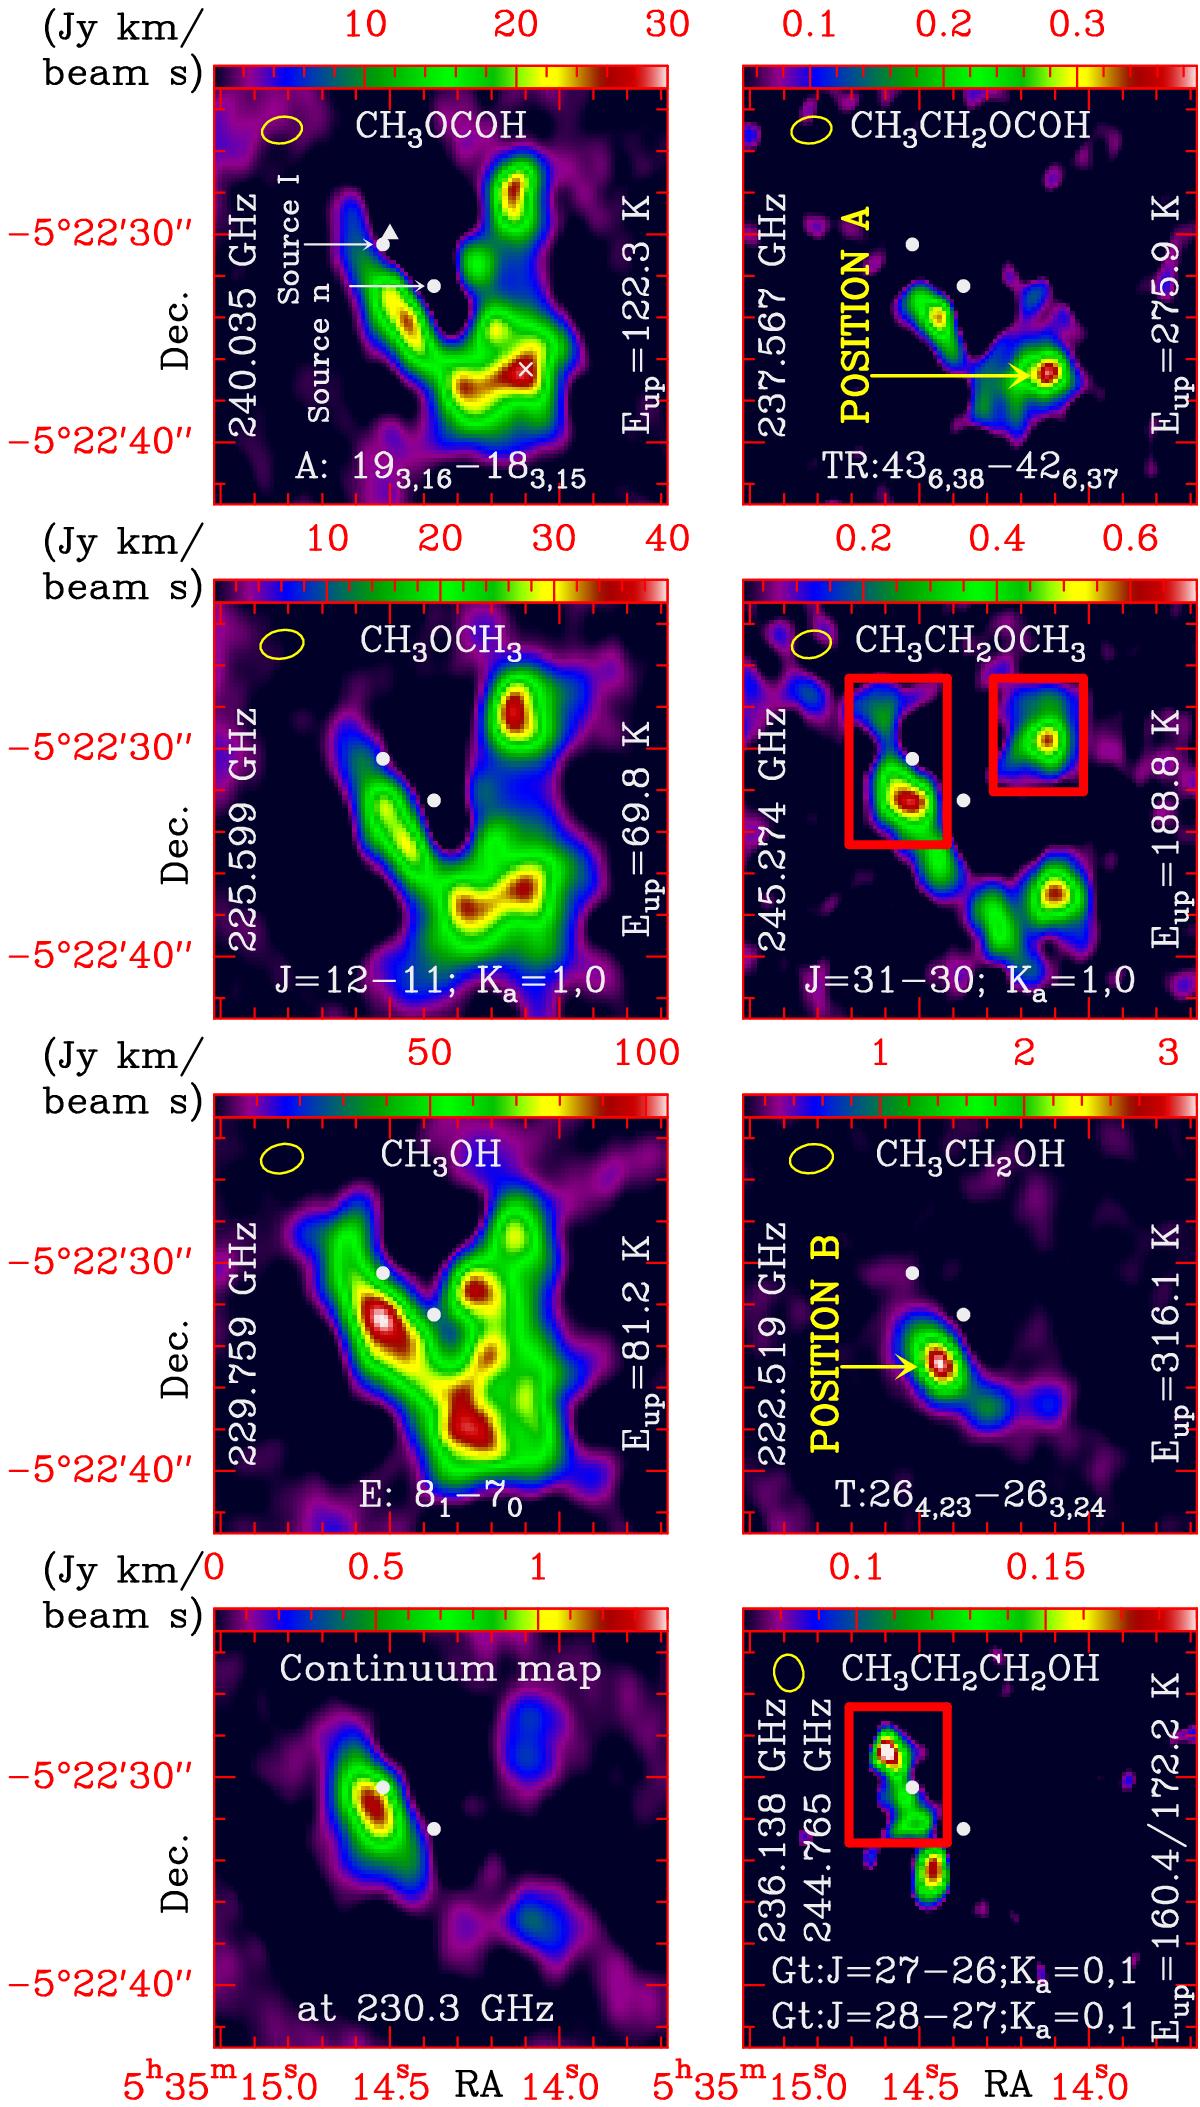
ALMA maps of organic saturated O-bearing molecules in Orion KL which have been detected containing both the methyl and the ethyl group, as well as a map of Gt-n-propanol and a continuum map at the central frequencies of the ALMA SV band (~230 GHz). Emission that probably arises from blended species in these maps is confined inside red rectangles. The yellow ellipse at the top left corner of the maps represents the ALMA synthetic beam. Triangle symbol: IRAM 30 m “survey position” (see Sect. 2). Cross symbol: IRAM 30 m compact ridge position (see Sect. 2). Position A: compact ridge (coordinates α2000.0 = 5h35m14![]() 1, δ2000.0 = −5°22′37
1, δ2000.0 = −5°22′37![]() 9). Position B: south hot core (coordinates α2000.0 = 5h35m14
9). Position B: south hot core (coordinates α2000.0 = 5h35m14![]() 4, δ2000.0 = −5°22′34
4, δ2000.0 = −5°22′34![]() 9).
9).
Current usage metrics show cumulative count of Article Views (full-text article views including HTML views, PDF and ePub downloads, according to the available data) and Abstracts Views on Vision4Press platform.
Data correspond to usage on the plateform after 2015. The current usage metrics is available 48-96 hours after online publication and is updated daily on week days.
Initial download of the metrics may take a while.