Fig. 3
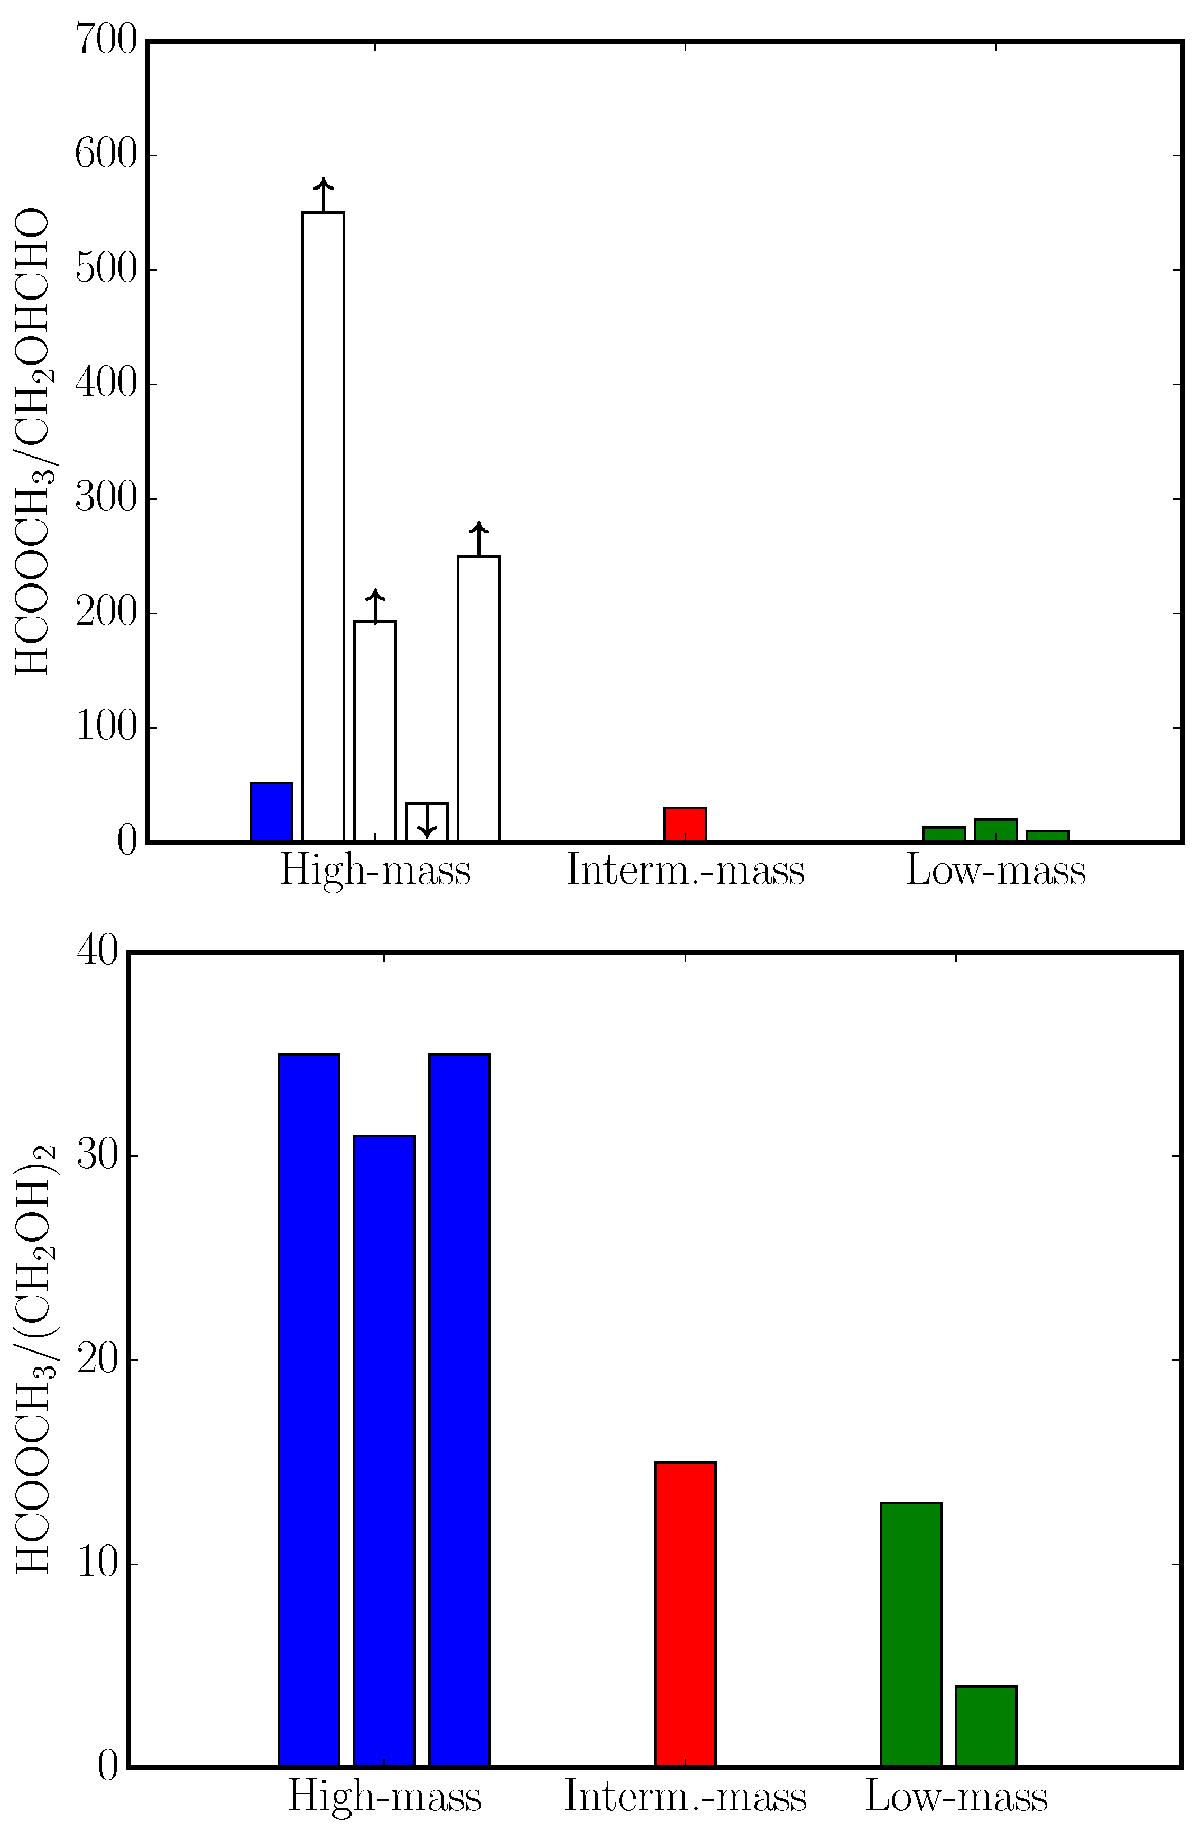
Schematic bar plot of HCOOCH3/CH2OHCHO (top) and HCOOCH3/(CH2OH)2 (bottom) against Lbol. The sources from Table 4 have been plotted in descending order of luminosity from left to right on the x-axis, but not to scale, and the sources have been grouped into high-mass sources (blue), intermediate-mass protostar (red) and low-mass protostars (green). The white bars for four of the high-mass sources are upper or lower levels, which is indicated by the direction of the arrow. The luminosity for the top plot spans from Sgr B2(N) with Lbol = 107L⊙ to IRAS NGC 1333 4A with Lbol = 7.7 L⊙, while it spans from W51/e2 with Lbol = 4.7 × 10⁶L⊙ to IRAS NGC 1333 4A with Lbol = 20 L⊙ in the bottom plot.
Current usage metrics show cumulative count of Article Views (full-text article views including HTML views, PDF and ePub downloads, according to the available data) and Abstracts Views on Vision4Press platform.
Data correspond to usage on the plateform after 2015. The current usage metrics is available 48-96 hours after online publication and is updated daily on week days.
Initial download of the metrics may take a while.