Fig. 1
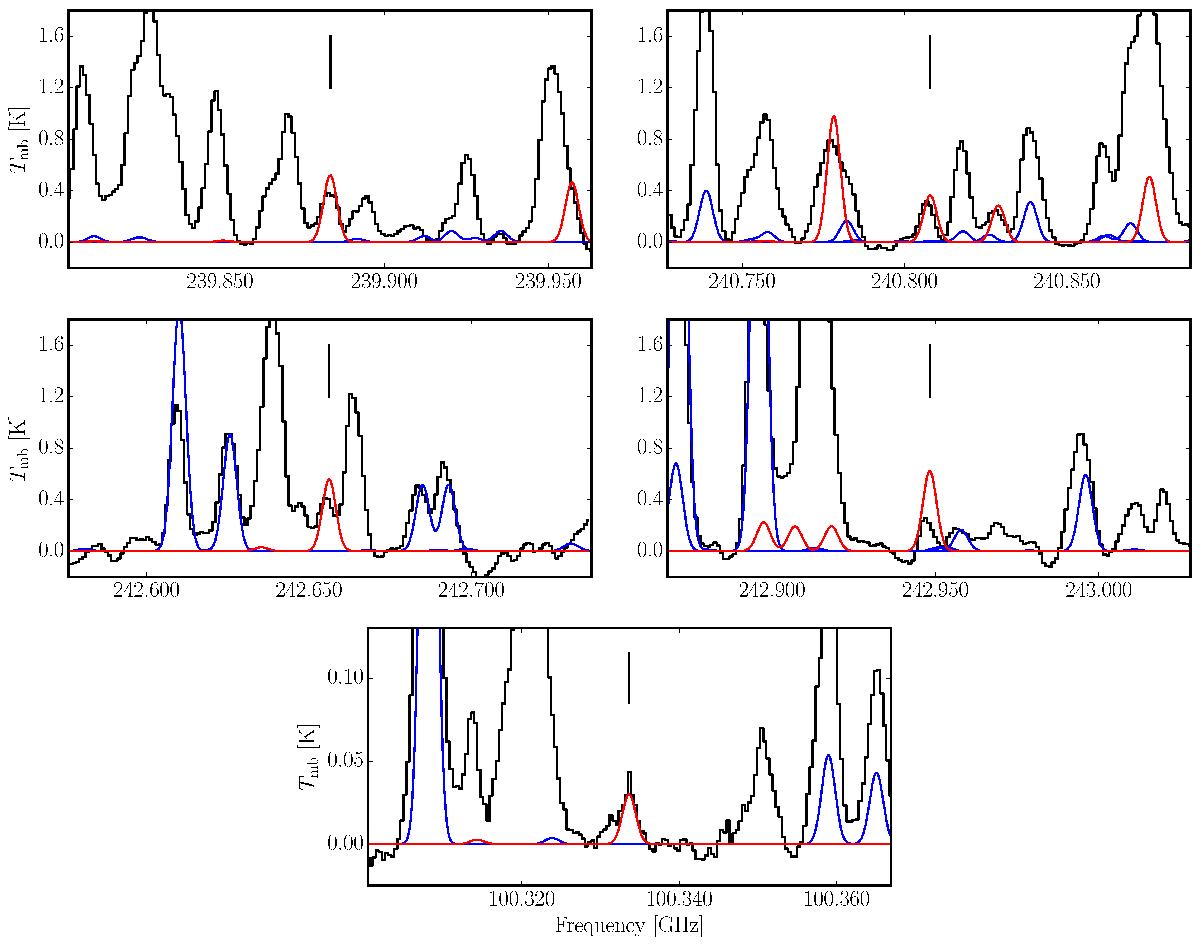
Observed (black) and synthetic (red) spectra of the five transitions of (CH2OH)2 in W51/e2 that are used for the analysis. Also shown are the synthetic spectra of all other species investigated in this study (blue) to demonstrate that the (CH2OH)2 lines in question are not blended. The transitions are located at 239 883.56, 240 807.88, 242 656.23, 242 948.29 and 100 333.64 MHz – denoted by black vertical lines in the plot. The displayed frequency region in each plot corresponds to ~200 km s-1.
Current usage metrics show cumulative count of Article Views (full-text article views including HTML views, PDF and ePub downloads, according to the available data) and Abstracts Views on Vision4Press platform.
Data correspond to usage on the plateform after 2015. The current usage metrics is available 48-96 hours after online publication and is updated daily on week days.
Initial download of the metrics may take a while.