Fig. 6
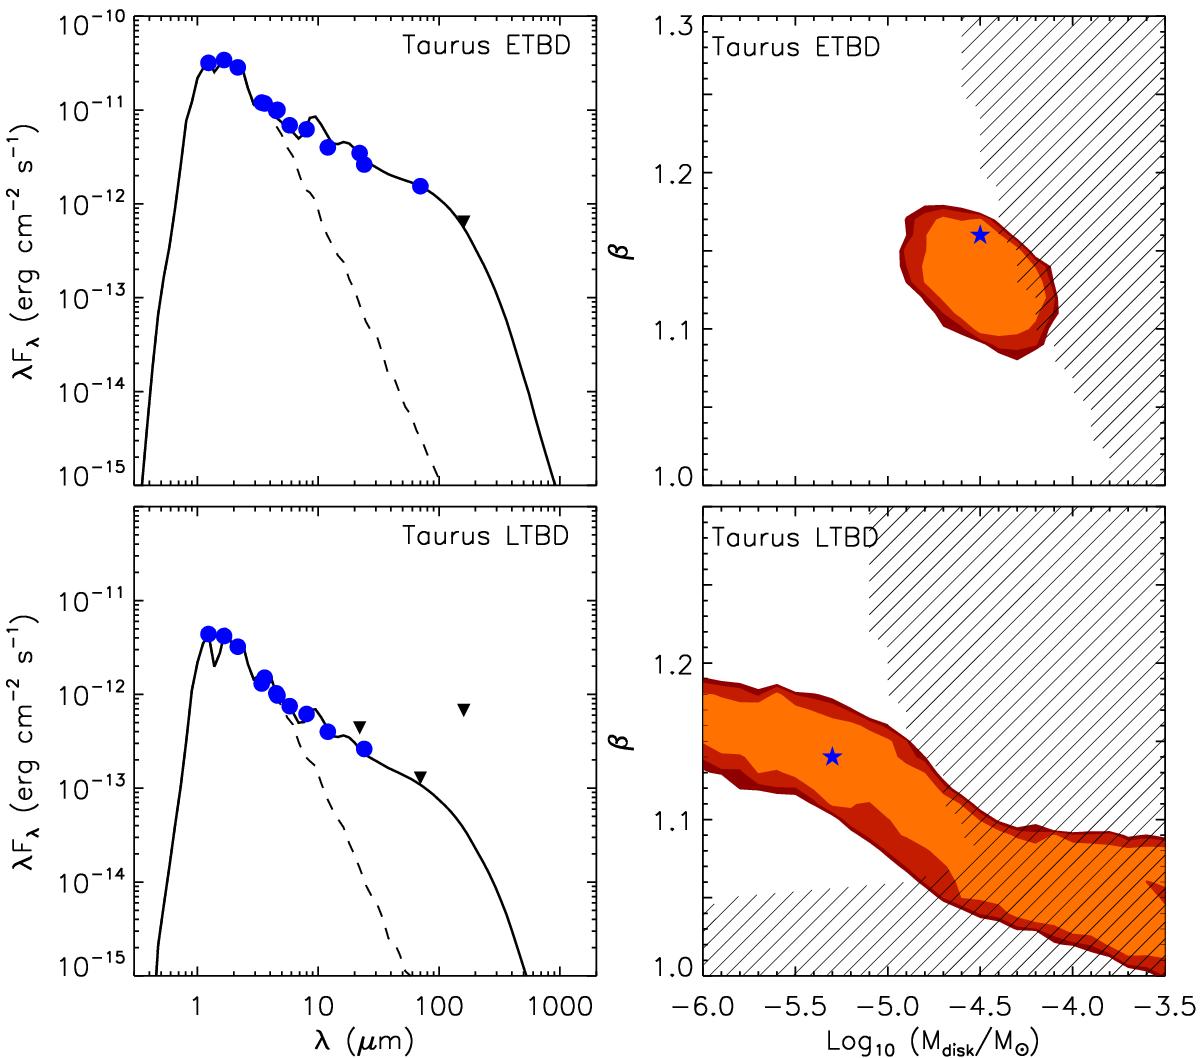
Left panels: median SEDs of Class II ETBDs (upper) and LTBDs (lower) in the Taurus molecular cloud. The dots depict the median flux densities at various bands. The upside down triangles show that the median flux densities at the corresponding wavelengths are treated as upper limits. The best-fit models are indicated with solid lines, whereas the dashed lines mark the photospheric emission levels. In the fitting procedure, the disk scale height H100 and inclination i are fixed to 14 AU and 45°, respectively. The parameter set of the best model in the upper panel: Rin = 0.09 AU, Mdisk = 3 × 10⁻⁵ M⊙, β = 1.16. The parameter values of the best model in the lower panel: Rin = 0.03 AU, Mdisk = 5 × 10⁻⁶ M⊙, β = 1.14. Right panels: 2D contour plots of the χ2 function projected over disk mass Mdisk and flaring index β. Contours with different shades of red are drawn at the 68%, 90%, 95% 2D confidence intervals. The blue stars represent the best-fit disk models. The hashed regions correspond to models that overpredict the upper limits of the median flux density.
Current usage metrics show cumulative count of Article Views (full-text article views including HTML views, PDF and ePub downloads, according to the available data) and Abstracts Views on Vision4Press platform.
Data correspond to usage on the plateform after 2015. The current usage metrics is available 48-96 hours after online publication and is updated daily on week days.
Initial download of the metrics may take a while.