Fig. 4
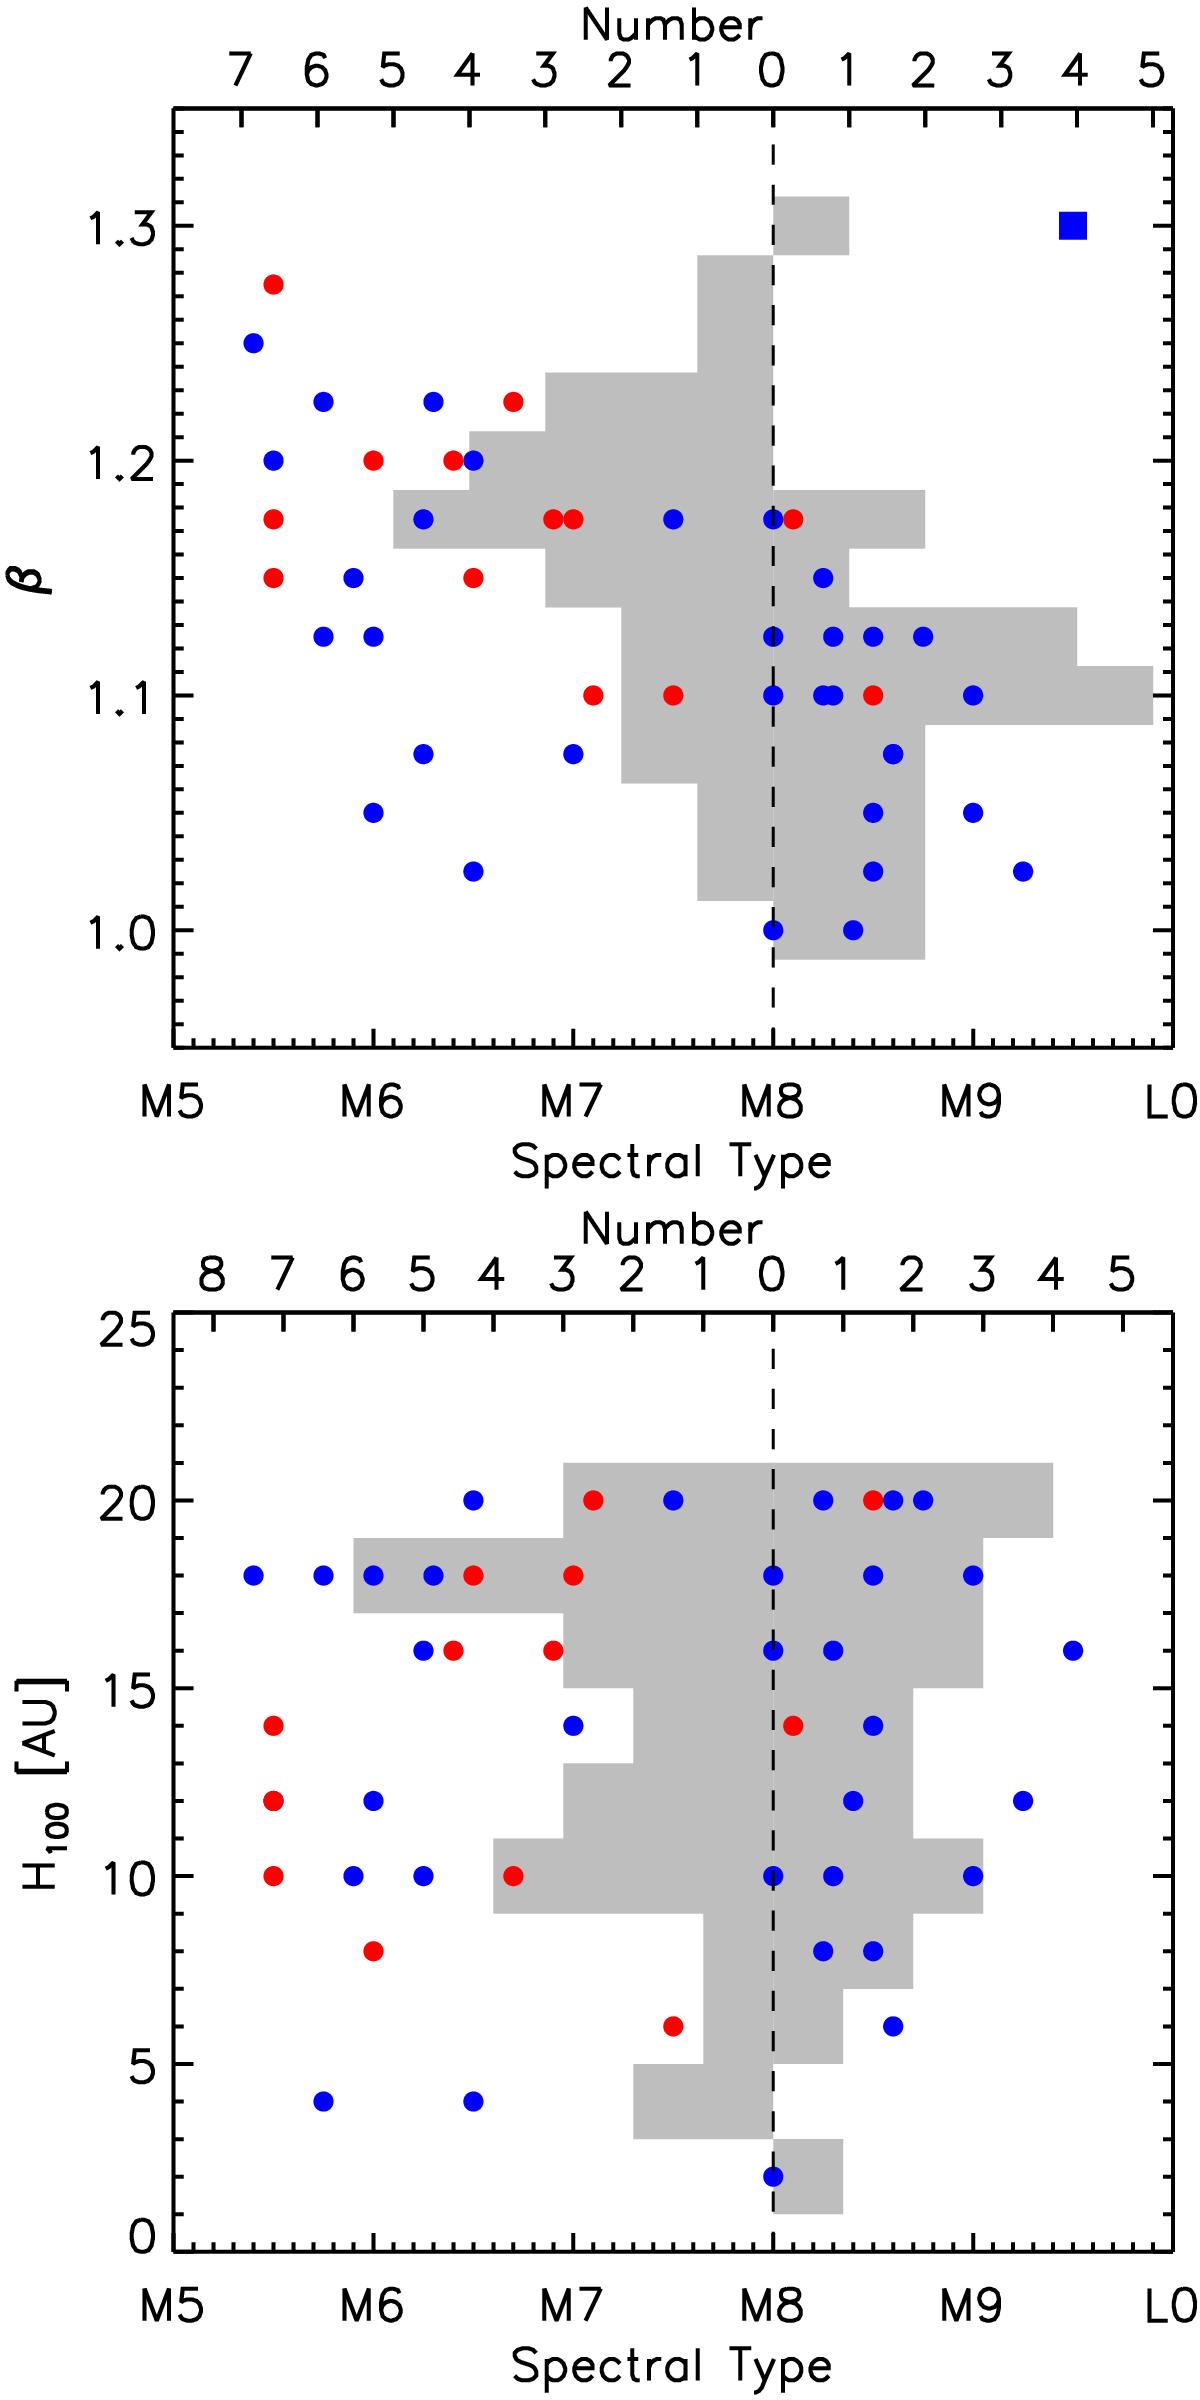
Flaring index β (top) and scale height H100 (bottom) as a function of SpT. We found that β decreases clearly from early-type BDs to late-type BDs (top), while H100 appears independent of the spectral type in the BD regime. The inserted diagrams in each panel show the histograms of these two parameters calculated for targets that belong to the ETBD and LTBD groups, respectively. The vertical dashed lines symbolize the criterion (i.e., M8) used to divide the targets, see Sect. 2. Blue dots represent objects located in clusters with ages < 5 Myr, whereas the red dots refer to older (≳ 5 Myr) targets. The blue square in the upper panel points to the obvious outlier target (OTS 44) of the observed relation. For better representation, slight changes in either the SpT or disk parameters are made for objects with a pair of identical values.
Current usage metrics show cumulative count of Article Views (full-text article views including HTML views, PDF and ePub downloads, according to the available data) and Abstracts Views on Vision4Press platform.
Data correspond to usage on the plateform after 2015. The current usage metrics is available 48-96 hours after online publication and is updated daily on week days.
Initial download of the metrics may take a while.