Fig. 3
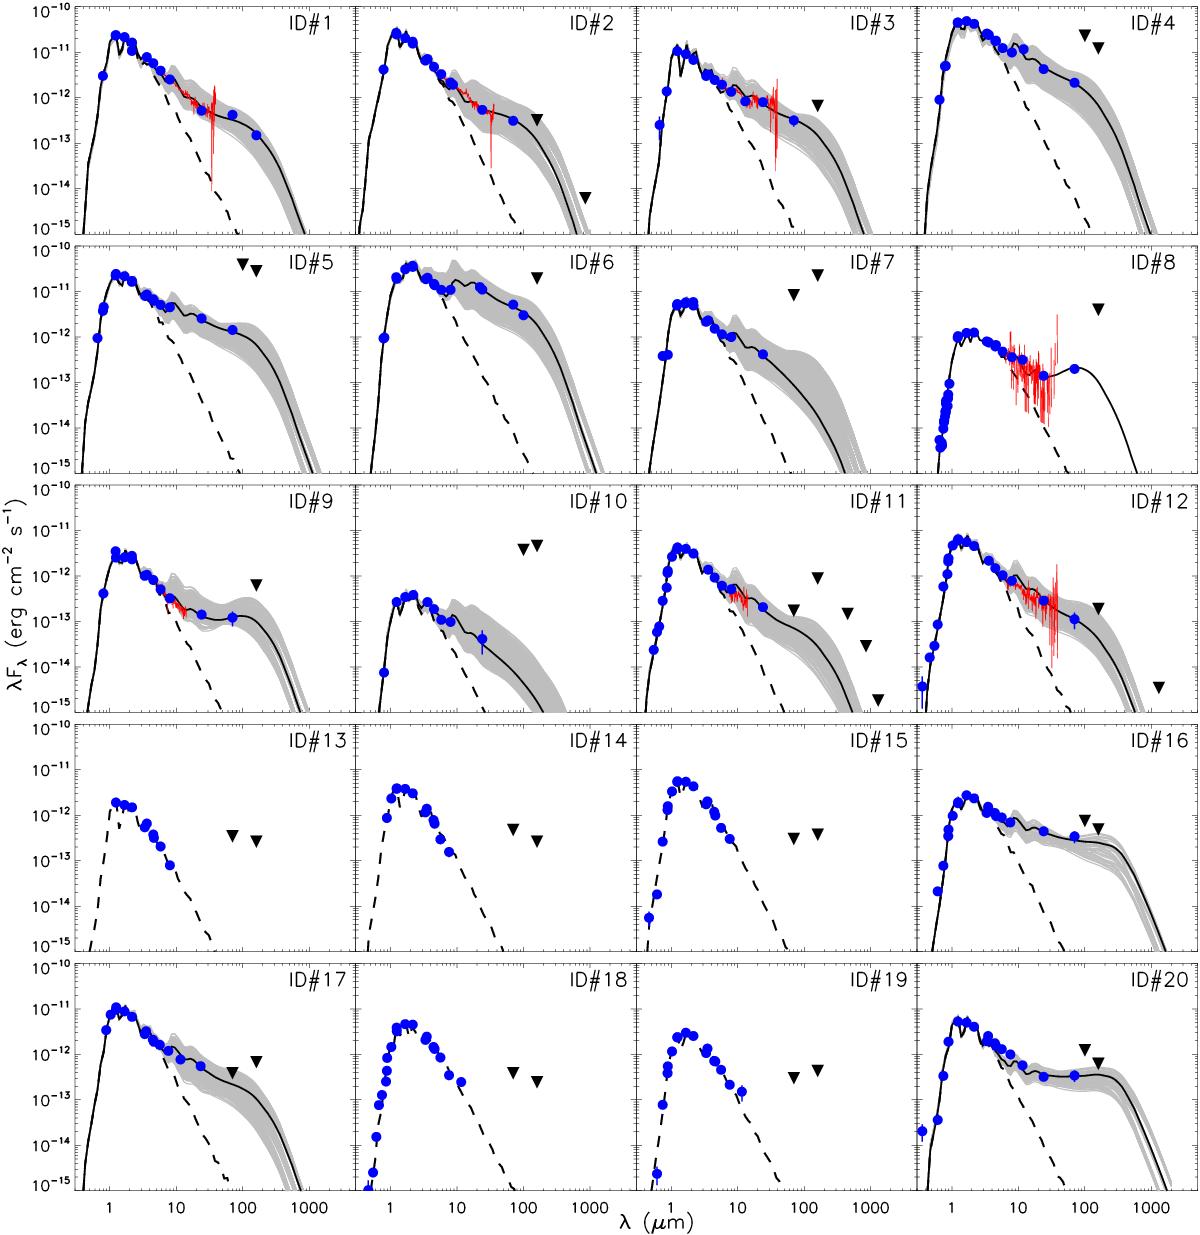
Spectral energy distributions of the target disks. The dots depict the photometry at various wavelengths. Spitzer/IRS spectra are indicated with red lines. The upside down triangles show the 3σ upper limits of the flux density. The best-fit models are indicated with black solid lines, whereas the dashed lines represent the photospheric emission levels. The gray lines denote all probable model fits that are derived by Bayesian analysis, showing the strength of constraints of the best-fit models for each object, see Sect. 4.3.
Current usage metrics show cumulative count of Article Views (full-text article views including HTML views, PDF and ePub downloads, according to the available data) and Abstracts Views on Vision4Press platform.
Data correspond to usage on the plateform after 2015. The current usage metrics is available 48-96 hours after online publication and is updated daily on week days.
Initial download of the metrics may take a while.