Fig. 1
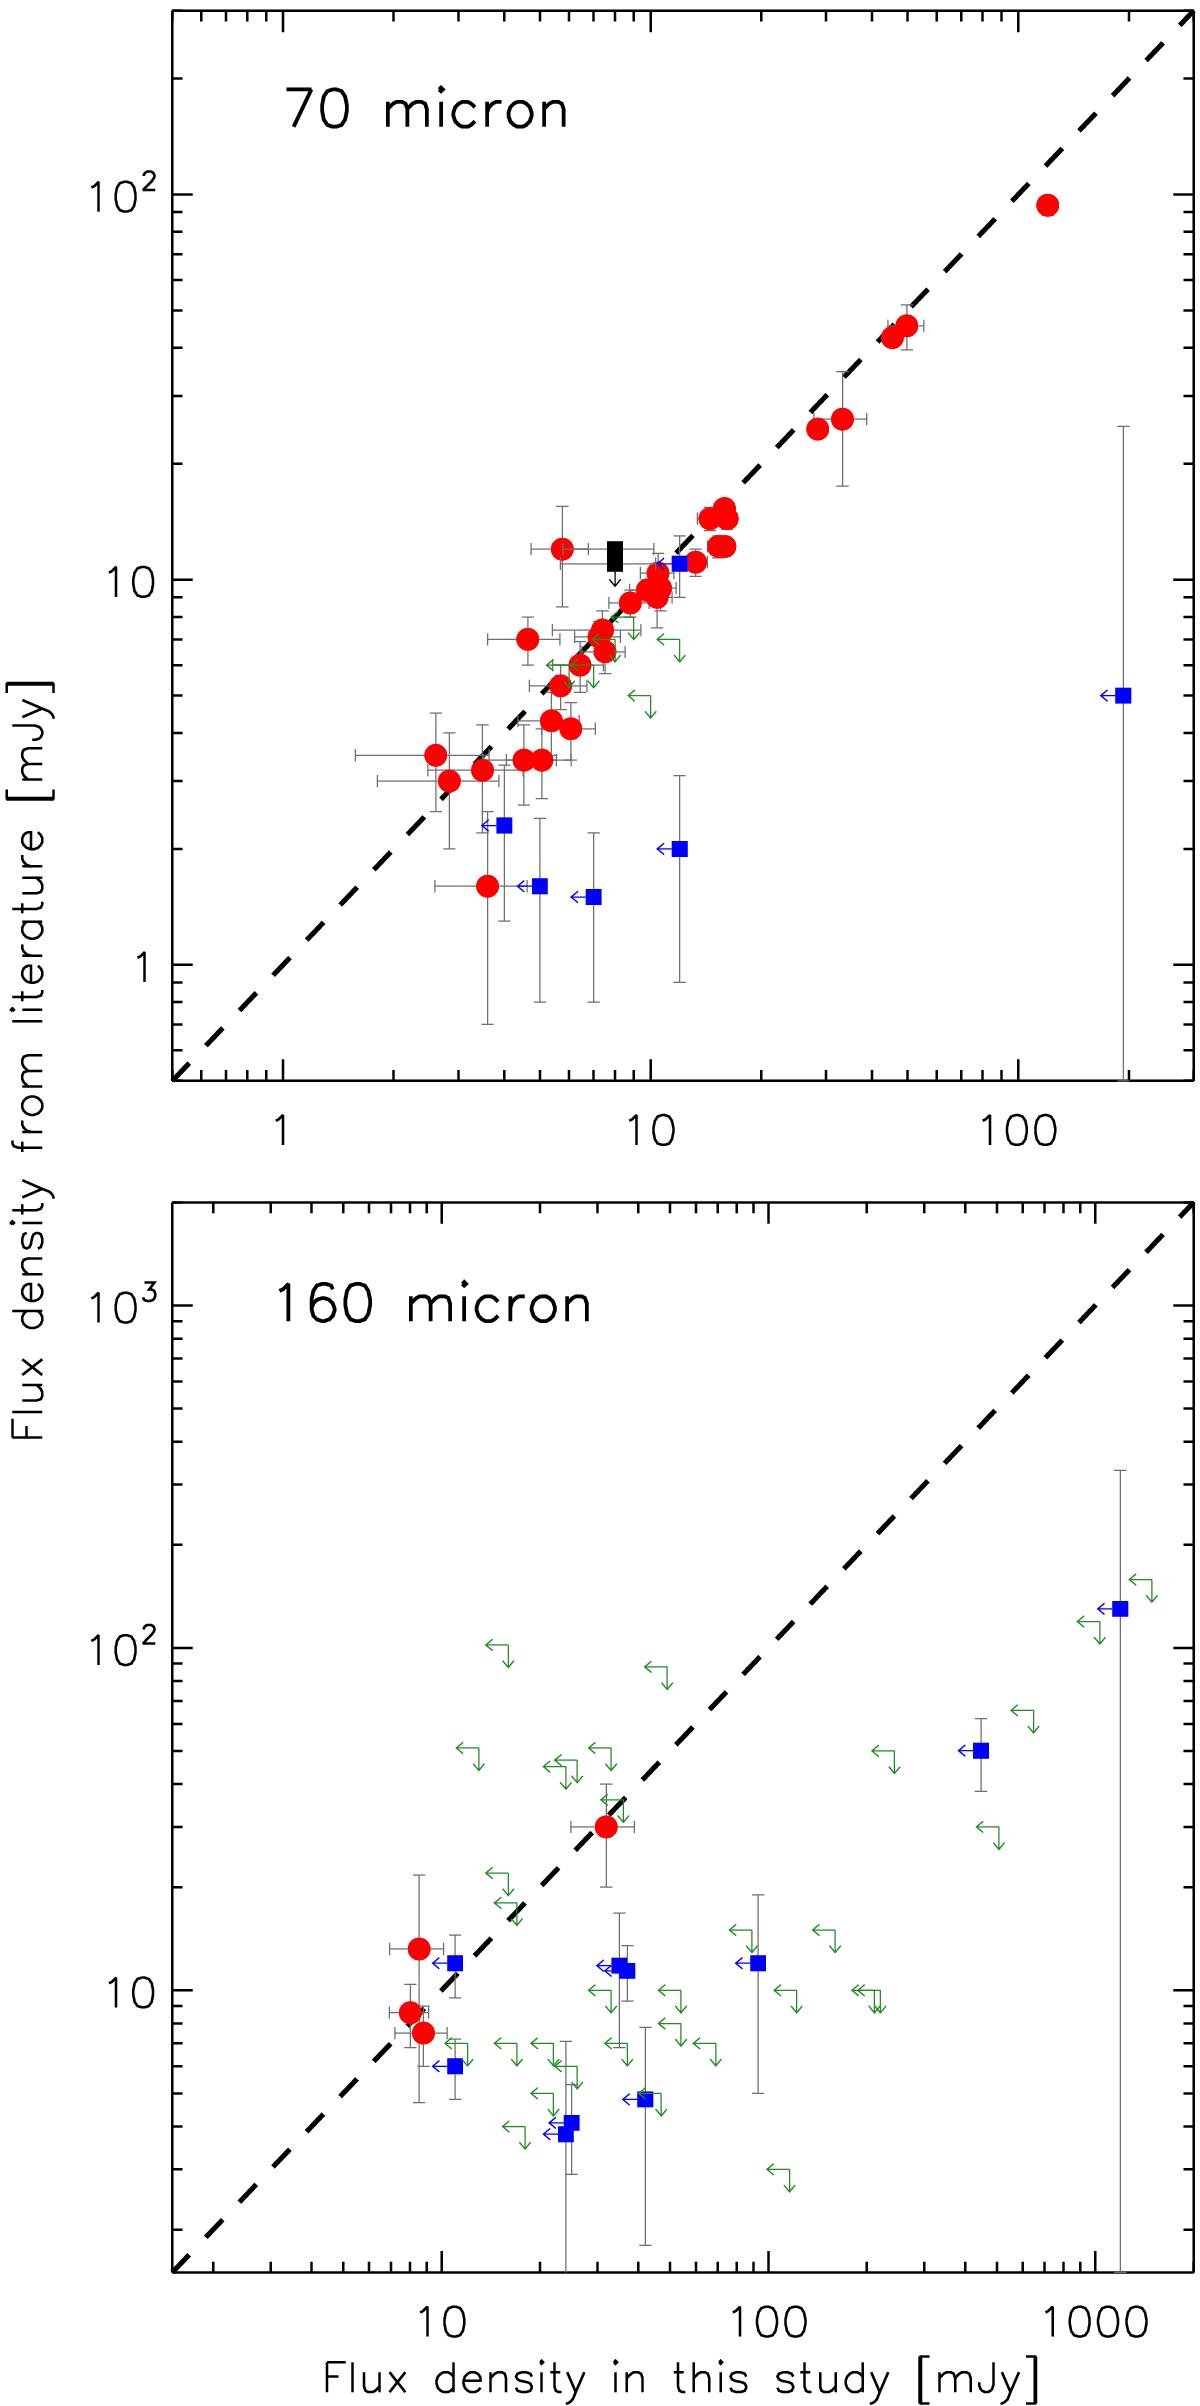
Our Herschel/PACS flux densities at 70 μm (upper panel) and 160 μm (lower panel) as compared to previous results. The red dots depict real detections identified by both our work and previous works, whereas green marks consisting of leftward and downward arrows symbolize the upper limits. The black squares with downward arrows and blue squares with leftward arrows show detections by our study and previous works, respectively.
Current usage metrics show cumulative count of Article Views (full-text article views including HTML views, PDF and ePub downloads, according to the available data) and Abstracts Views on Vision4Press platform.
Data correspond to usage on the plateform after 2015. The current usage metrics is available 48-96 hours after online publication and is updated daily on week days.
Initial download of the metrics may take a while.