Fig. 6
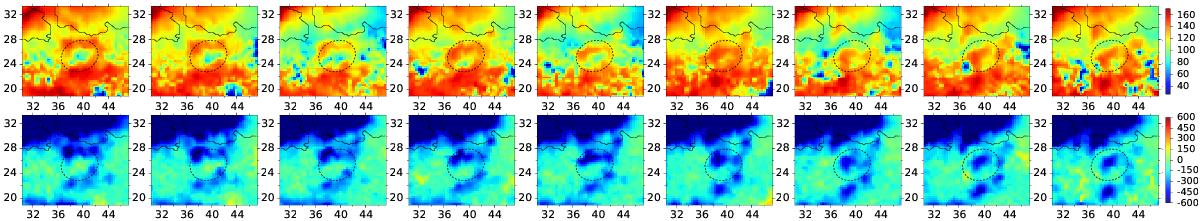
Magnetic field inclination (top) and flux (bottom) in the local reference frame from HMI data with 12-min cadence. Time increases from left to right between 7:00 and 8:36. The contour, circle, and coordinates are as in the full maps (Figs. 1, 3–5). The yellow patch seen in the center of the circle at left in the flux maps disappears gradually. Inclination is in degrees and flux in G.
Current usage metrics show cumulative count of Article Views (full-text article views including HTML views, PDF and ePub downloads, according to the available data) and Abstracts Views on Vision4Press platform.
Data correspond to usage on the plateform after 2015. The current usage metrics is available 48-96 hours after online publication and is updated daily on week days.
Initial download of the metrics may take a while.