Free Access
Fig. 5
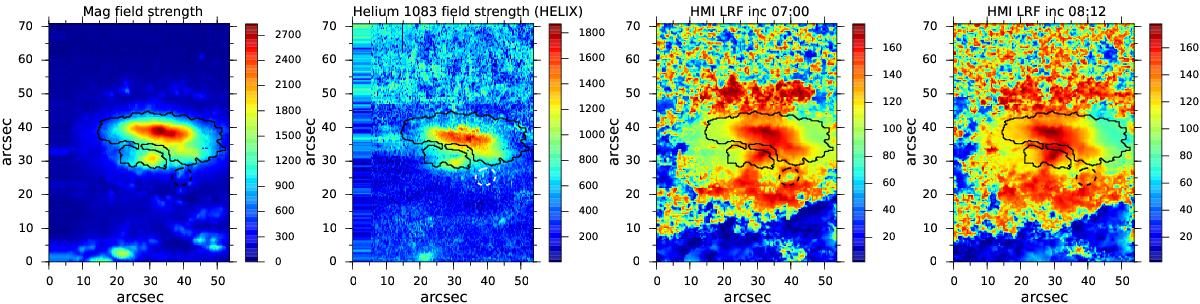
Left to right: photospheric magnetic field strength from SIR inversion (G), chromospheric magnetic field strength from HeLIx+ inversion (G), and the LRF inclination maps of HMI data at 07:00 and 08:12 (deg). For a description of the contour and circle, see Fig. 1.
Current usage metrics show cumulative count of Article Views (full-text article views including HTML views, PDF and ePub downloads, according to the available data) and Abstracts Views on Vision4Press platform.
Data correspond to usage on the plateform after 2015. The current usage metrics is available 48-96 hours after online publication and is updated daily on week days.
Initial download of the metrics may take a while.