Fig. 2
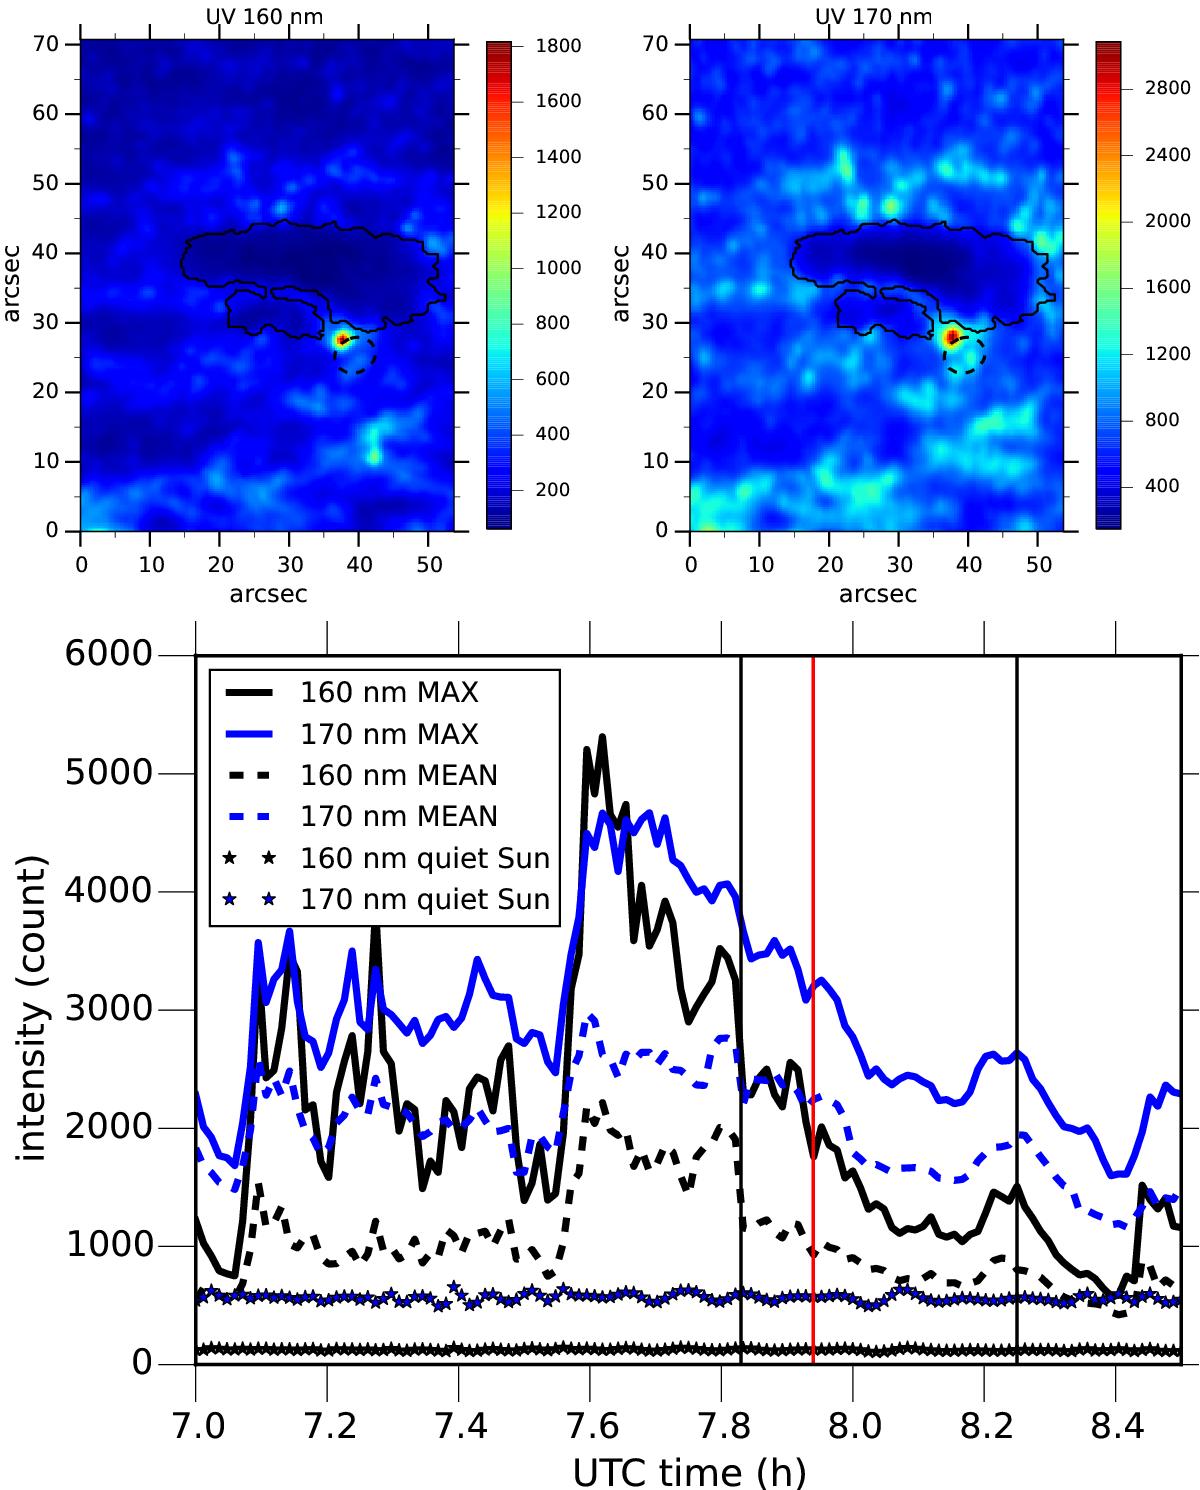
AIA data. Top row: filtergrams at 160 and 170 nm co-temporal with the profiles shown in Fig. 9. For a description of the contour and circle, see Fig. 1. Bottom panel: temporal variation of the intensity of the EB in AIA 160 and 170 nm images. The vertical lines mark the time span of the VTT observations. The red line marks the time at which the the slit passed across the EB.
Current usage metrics show cumulative count of Article Views (full-text article views including HTML views, PDF and ePub downloads, according to the available data) and Abstracts Views on Vision4Press platform.
Data correspond to usage on the plateform after 2015. The current usage metrics is available 48-96 hours after online publication and is updated daily on week days.
Initial download of the metrics may take a while.