Fig. 6
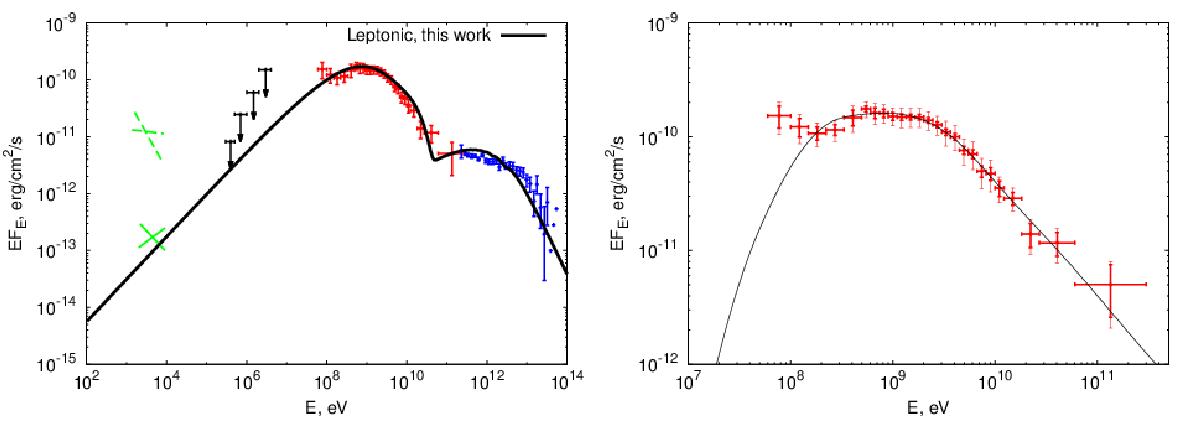
Left panel: X-ray to TeV energies spectrum of the Galactic centre. The data are adopted from Baganoff et al. (2003) (green solid cross, X-ray quiescent), Porquet et al. (2008) (green dashed cross, X-ray flaring), this work (red points) and Aharonian et al. (2009) (blue points, HESS). The INTEGRAL/PICsIT upper limits (this work) are shown in black. The leptonic model proposed in this work for the low-density case is shown with the solid black line. Right panel: hadronic model of γ-ray radiation from the broken power-law distribution of protons. The model significantly under predicts the flux at ≲150 MeV energies (black line); see text for details. The statistical error is shown with thick errorbars, while the thin ones indicate systematic levels, which are shown in the left panel.
Current usage metrics show cumulative count of Article Views (full-text article views including HTML views, PDF and ePub downloads, according to the available data) and Abstracts Views on Vision4Press platform.
Data correspond to usage on the plateform after 2015. The current usage metrics is available 48-96 hours after online publication and is updated daily on week days.
Initial download of the metrics may take a while.