Fig. 3
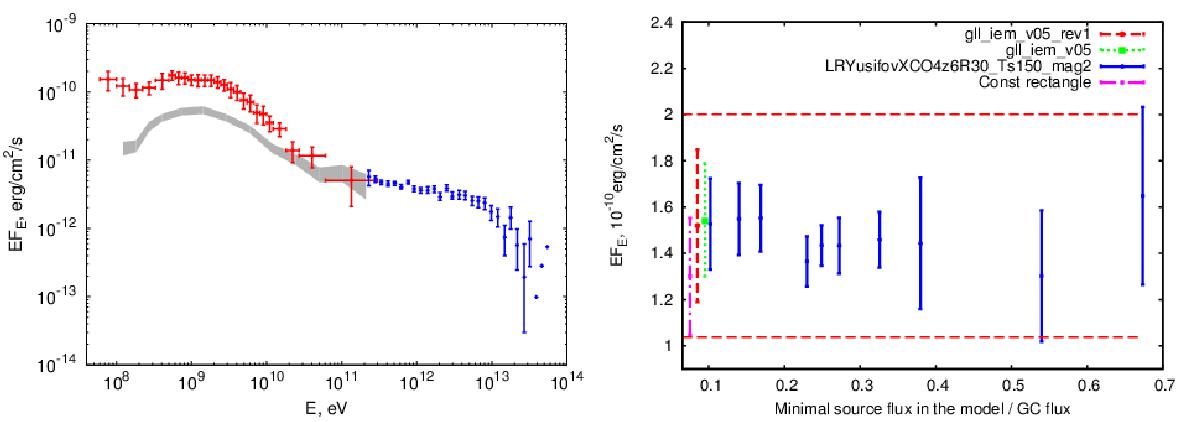
Left panel: combined Fermi/LAT -HESS spectrum of the Galactic centre with added systematic errors. The spectrum of the Galactic bulge from “constant rectangle” model (renormalised to match the GC flux in the highest energy Fermi data point) is shown with grey shaded region, see text for the details. Right panel: flux in 60−100 MeV energy bin as a function of minimal catalogue flux of the sources included into the model(for LRYusifovXCO4z6R30_Ts150_mag2 model of the Galactic diffuse emission). The corresponding results for gll_iem_v05_rev1.fits, gll_iem_v05.fits and “constant rectangle” diffuse models are shown with red dashed, green dotted, and magenta dot-dashed points. The horizontal dashed lines indicate the flux errorbars in 60−100 MeV band from the left panel.
Current usage metrics show cumulative count of Article Views (full-text article views including HTML views, PDF and ePub downloads, according to the available data) and Abstracts Views on Vision4Press platform.
Data correspond to usage on the plateform after 2015. The current usage metrics is available 48-96 hours after online publication and is updated daily on week days.
Initial download of the metrics may take a while.