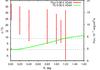
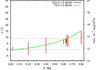
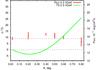
Fig. 2
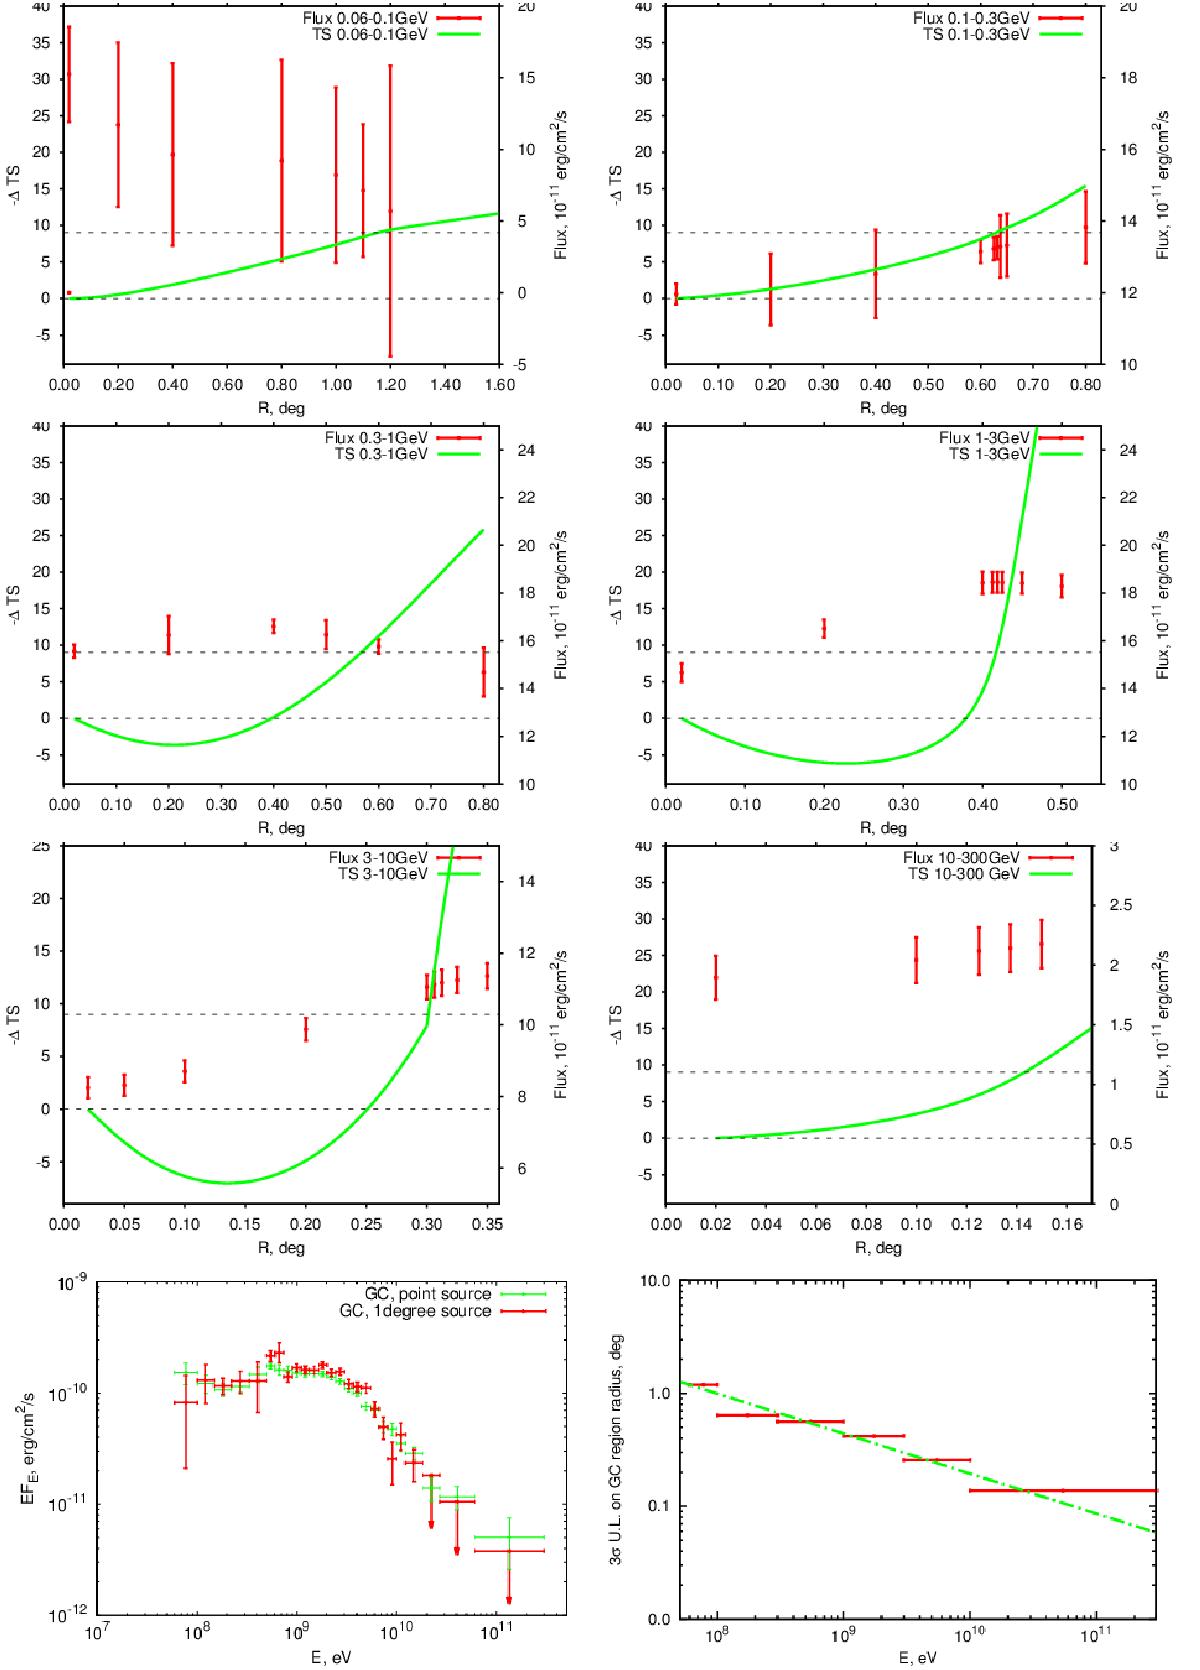
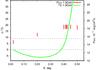
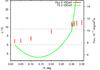
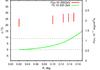
Change (in the comparison with the point source) of the TS value attributed to the GC modelled as a disk of certain radius. The increase of −ΔTS corresponds to the overall worsening of the fit. The change of −ΔTS by 9 corresponds to the 3σ upper limit on the size of the disk. The flux, attributed to the disk is shown with red points with errorbars. Bottom left panel: spectra of 1° radius template of the GC, and GC as a point source. Bottom right panel: 3σ upper limit on the size of the disk as a function of energy. The fit with the power law (R = 0.44°(E/ 1 GeV)-0.35) is shown with green dot-dashed line.
Current usage metrics show cumulative count of Article Views (full-text article views including HTML views, PDF and ePub downloads, according to the available data) and Abstracts Views on Vision4Press platform.
Data correspond to usage on the plateform after 2015. The current usage metrics is available 48-96 hours after online publication and is updated daily on week days.
Initial download of the metrics may take a while.