Fig. 1
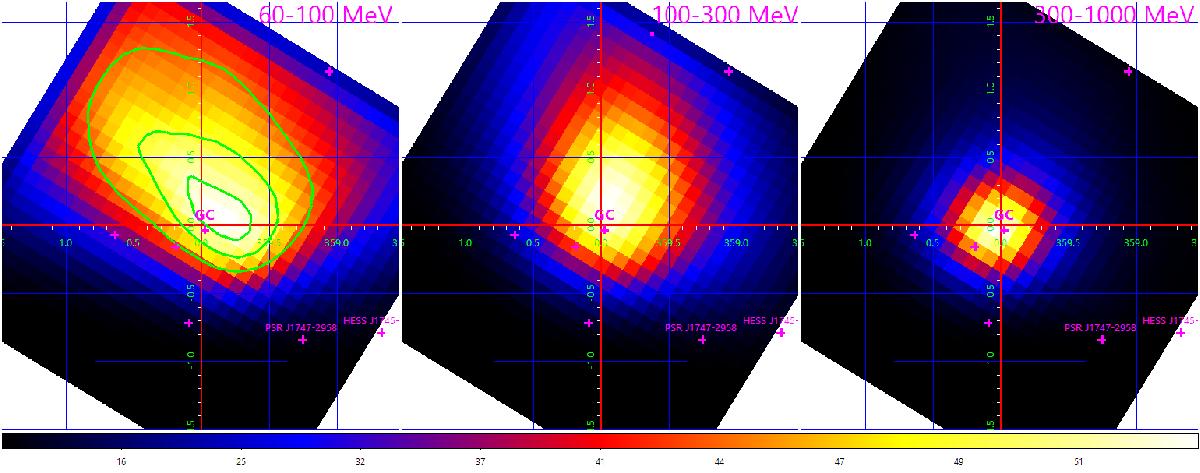
Test-statistic (TS) maps in 60−100 MeV, 100−300 MeV, and 300 MeV−1 GeV energy bands. Only diffuse and point-like sources beyond 0.7° from the position of GC were subtracted. The maximum of TS value corresponds to the most probable position of added point-like source. The contours for the localisation significance are shown with green solid lines for 60−100 MeV map and correspond to significances of 1, 2, and 3σ. The 2FGL catalogue coordinates of the GC only deviate from the maximum TS position at ~1σ level. The position of maximum shifts with the increase of energy to the position of Galactic centre.
Current usage metrics show cumulative count of Article Views (full-text article views including HTML views, PDF and ePub downloads, according to the available data) and Abstracts Views on Vision4Press platform.
Data correspond to usage on the plateform after 2015. The current usage metrics is available 48-96 hours after online publication and is updated daily on week days.
Initial download of the metrics may take a while.