Fig. 6
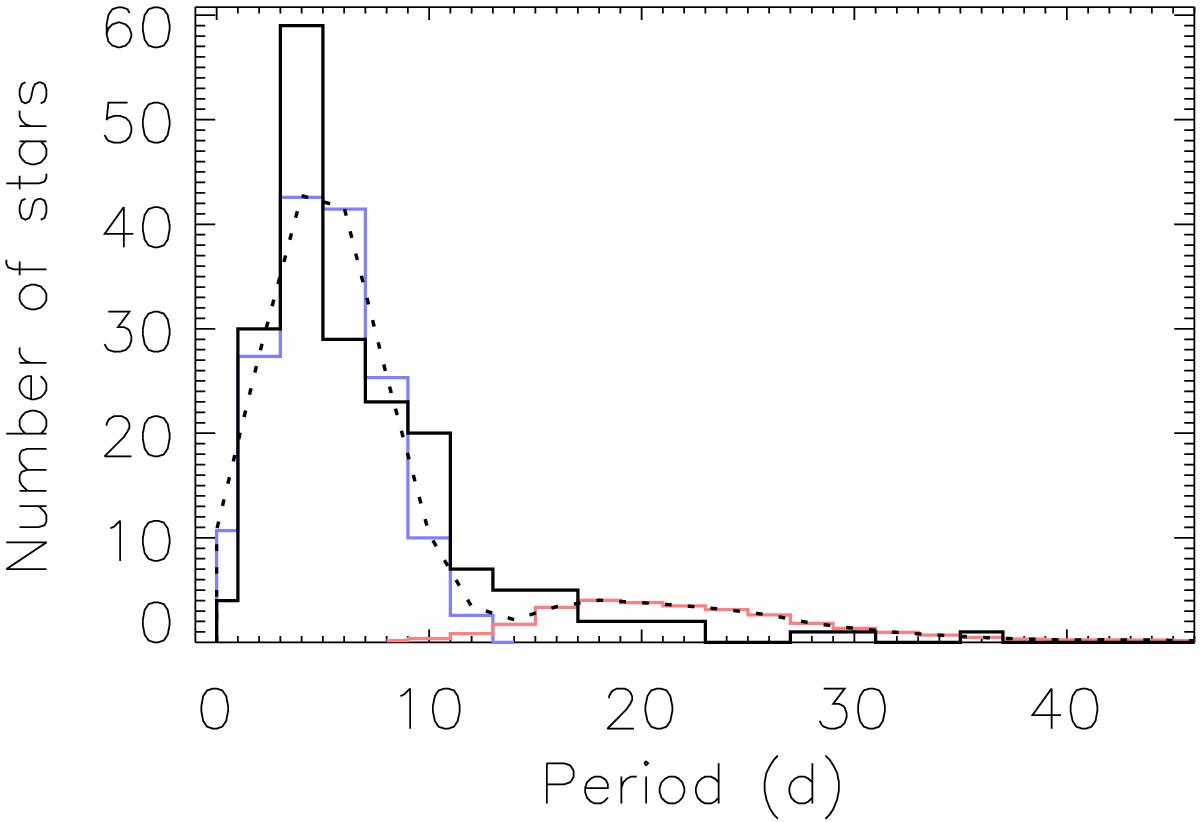
Rotation period distribution of a subset of CoRoT stars with Teff and log g similar to those of the Sun (the DMS⊙ sample). The original sample was obtained from DM13 combined with Sarro et al. (2013; the DMS sample). The black histogram shows the actual distribution. The blue and red histograms and the dotted curve correspond to a modeled distribution of the actual data where biases were simulated. Blue depicts a group of young stars (group I), red depicts a group of MS and evolved stars (group II), and the dotted curve is the sum of these two group distributions. The latter, which is the full distribution, is the synthetic data considered to fit with observations. For illustrative purposes, the levels of the modeled distributions were adjusted to make the total number of synthetic stars similar to that of the actual sample.
Current usage metrics show cumulative count of Article Views (full-text article views including HTML views, PDF and ePub downloads, according to the available data) and Abstracts Views on Vision4Press platform.
Data correspond to usage on the plateform after 2015. The current usage metrics is available 48-96 hours after online publication and is updated daily on week days.
Initial download of the metrics may take a while.