Fig. 5
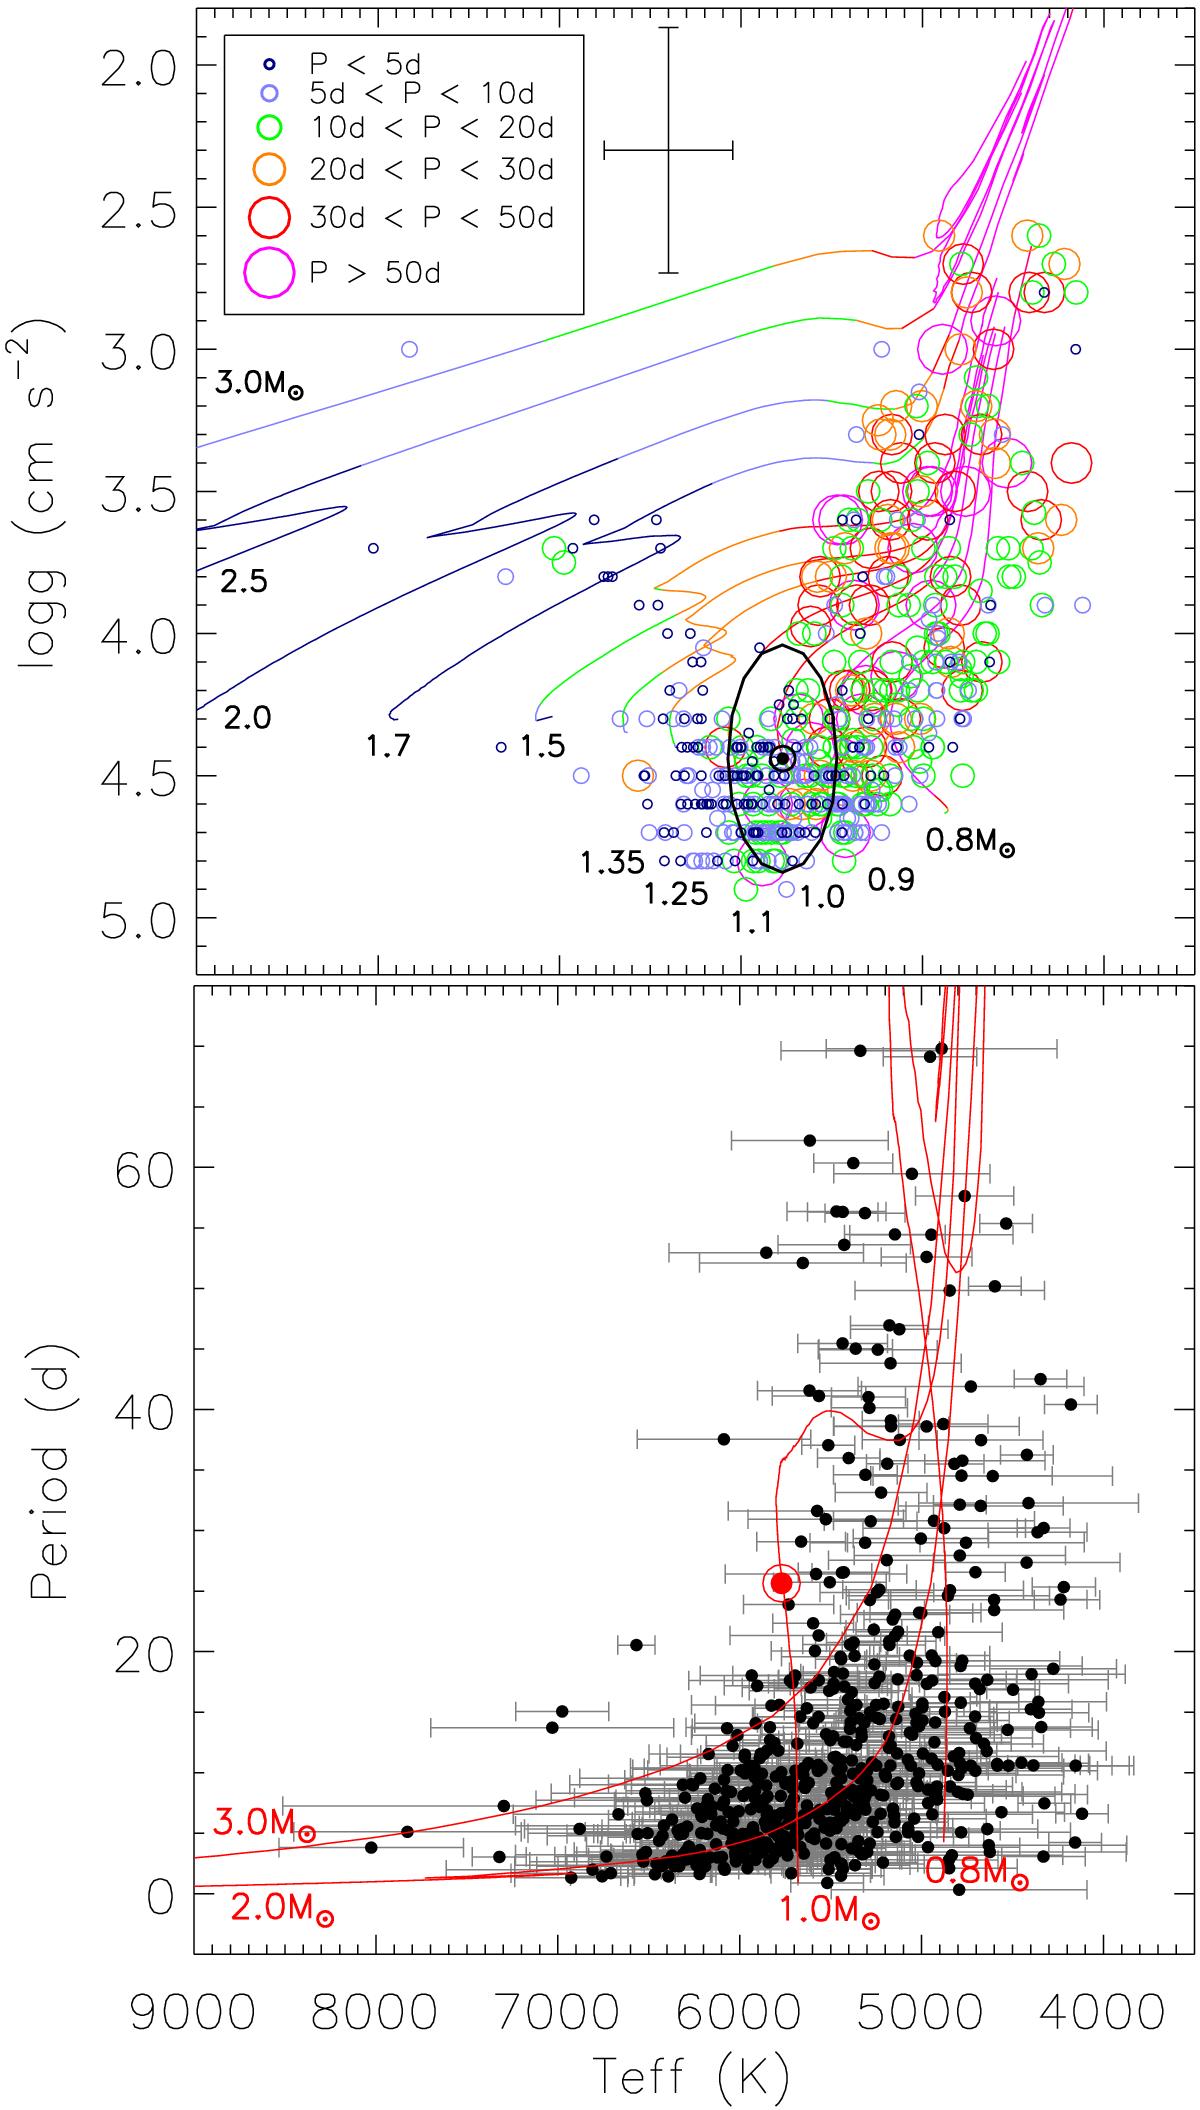
Top panel: HR diagram for the CoRoT rotating candidates of DM13 combined with the physical parameters of Sarro et al. (2013), namely, the DMS sample. Circle sizes and colors represent the period intervals shown in the legend. Theoretical tracks from Ekström et al. (2012) are plotted as solid lines for different masses, identified by corresponding labels. The colors represent theoretical rotation periods within the same intervals as in the legend. The typical Teff and log g uncertainties are illustrated by the error bars. The Sun-like sample is denoted within the ellipsis around the solar location. Bottom panel: photometric period as a function of effective temperature for the same sample as the top panel. The red solid lines represent theoretical tracks from Ekström et al. (2012) for four different masses. The Sun is denoted in both panels by the solar symbol.
Current usage metrics show cumulative count of Article Views (full-text article views including HTML views, PDF and ePub downloads, according to the available data) and Abstracts Views on Vision4Press platform.
Data correspond to usage on the plateform after 2015. The current usage metrics is available 48-96 hours after online publication and is updated daily on week days.
Initial download of the metrics may take a while.