Fig. 1
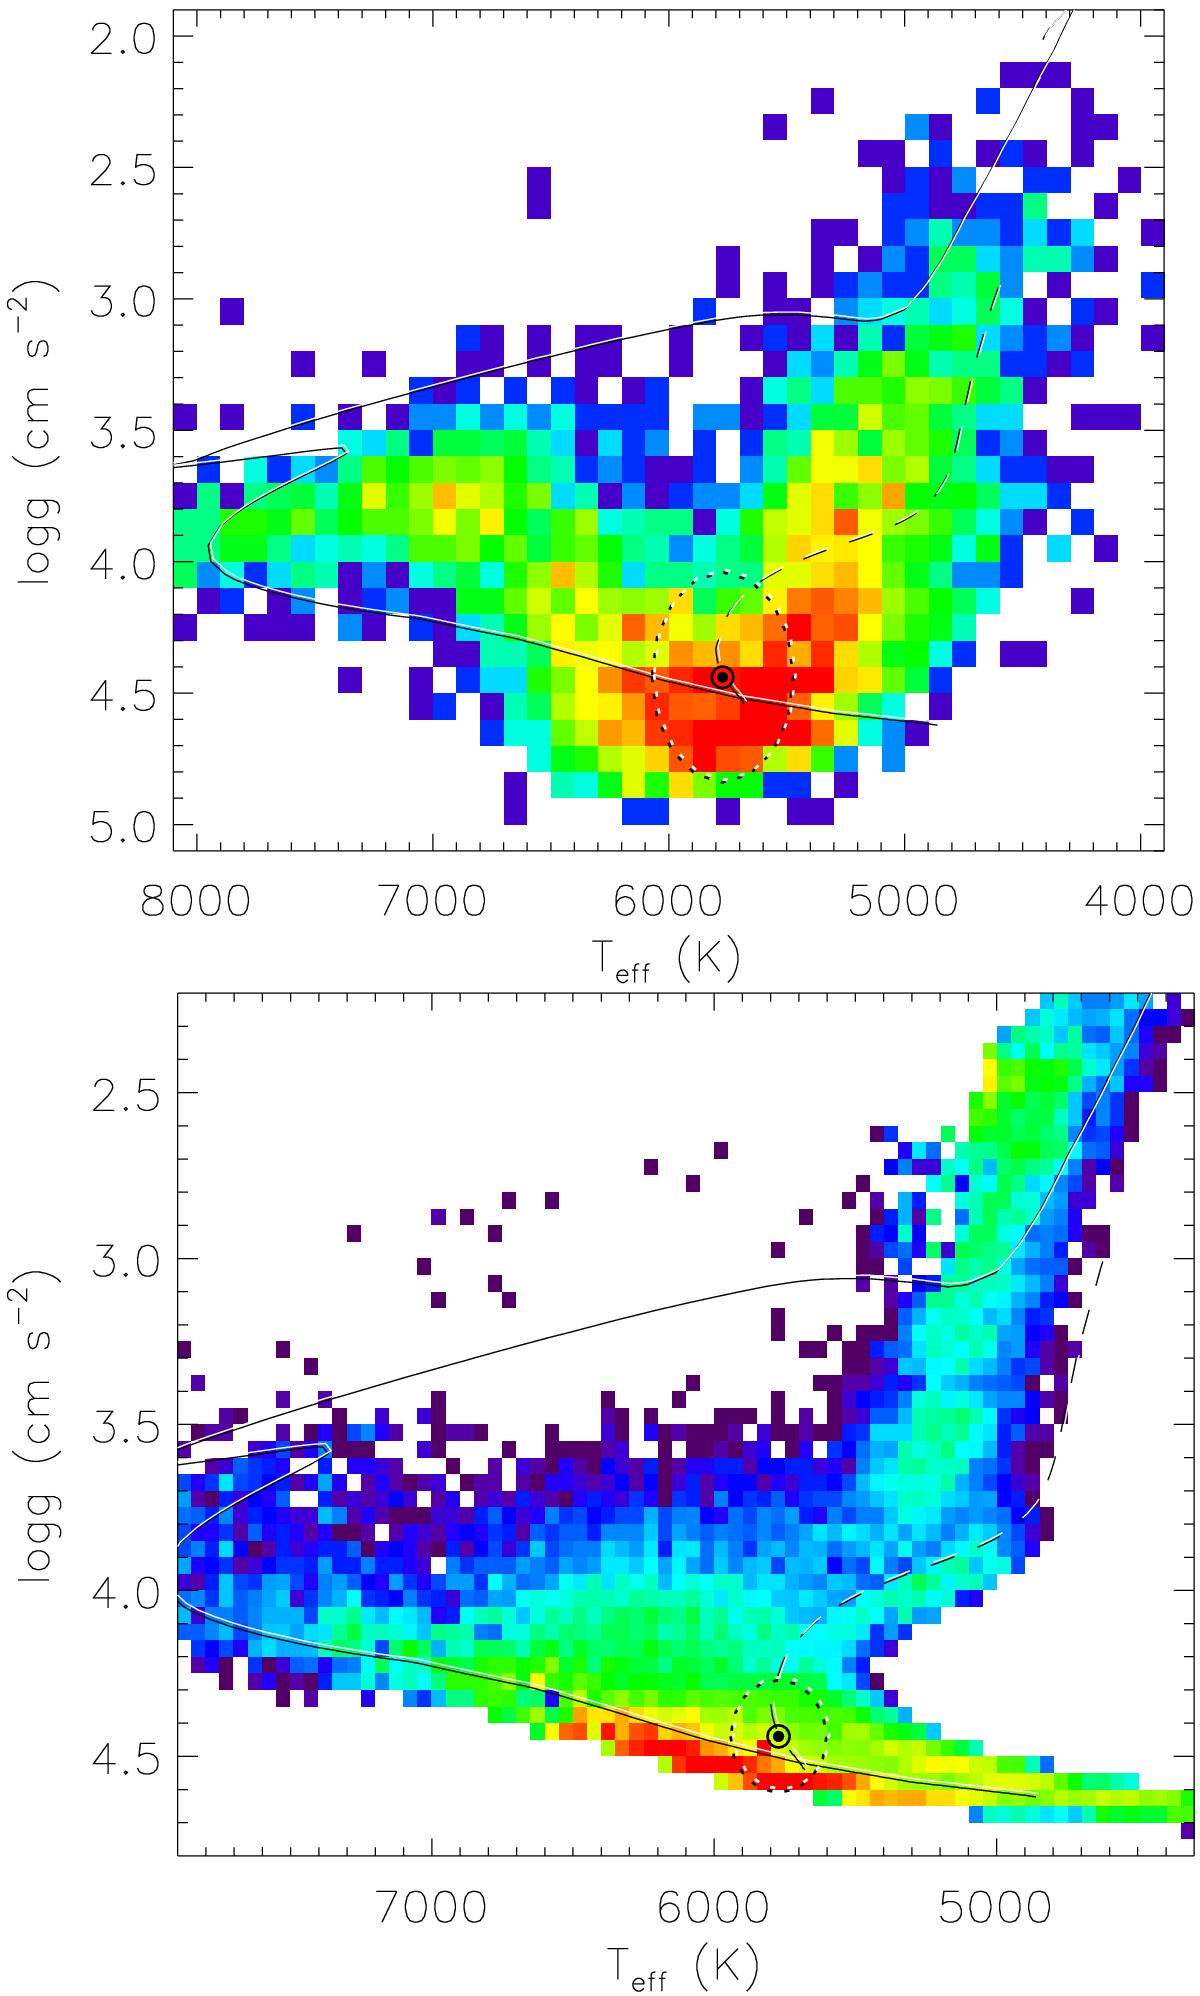
Probability distribution in the HR diagram for the parent samples considered in this work. Top panel: distribution for the CoRoT field, obtained from the full sample of Sarro et al. (2013). Bottom panel: distribution for the Kepler field, computed from a subselection of Huber et al. (2014) with a metallicity −0.2 dex < [Fe/H] < 0.2 dex. The red–green–blue color gradient in the map represents decreasing probability; the high end is the red part of the gradient. Solid lines indicate the 1 Gyr isochrone of Ekström et al. (2012), and dashed lines illustrate the 1 M⊙ theoretical track provided by the same authors. The Sun is represented by its standard symbol. The ellipses around the solar location depict the subsamples of Sun-like stars (Sun-like samples). These were selected equally within the typical uncertainties in Teff and log g for each parent sample for observed and synthetic data (see text).
Current usage metrics show cumulative count of Article Views (full-text article views including HTML views, PDF and ePub downloads, according to the available data) and Abstracts Views on Vision4Press platform.
Data correspond to usage on the plateform after 2015. The current usage metrics is available 48-96 hours after online publication and is updated daily on week days.
Initial download of the metrics may take a while.