Fig. 5
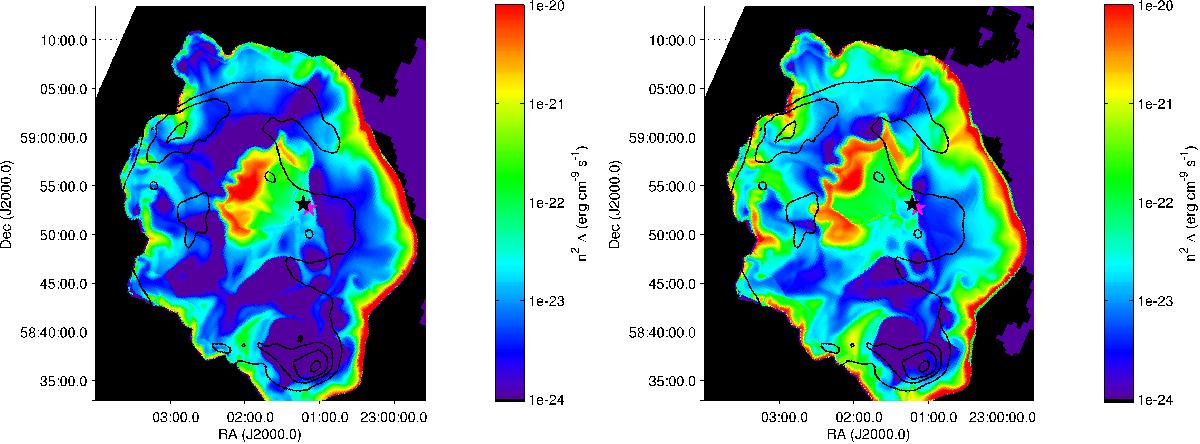
Left: modelled X-ray emissivity ε = n2 Λ(T,n) after 8000 yr (XMM-Newton density model) simulating the intensity map (0.3−4.0 keV) of CTB 109 from the XMM-Newton EPIC data (Sasaki et al. 2004) (cf. Fig. 1 (right)). Right: modelled X-ray emissivity ε = n2 Λ(T,n) after 11 000 yr (Chandra density model) using the same intensity map (0.3−4.0 keV) of CTB 109 from the XMM-Newton EPIC data. The position of the SN explosion is marked with a black star and the position of the AXP with a magenta star.
Current usage metrics show cumulative count of Article Views (full-text article views including HTML views, PDF and ePub downloads, according to the available data) and Abstracts Views on Vision4Press platform.
Data correspond to usage on the plateform after 2015. The current usage metrics is available 48-96 hours after online publication and is updated daily on week days.
Initial download of the metrics may take a while.