Fig. 4
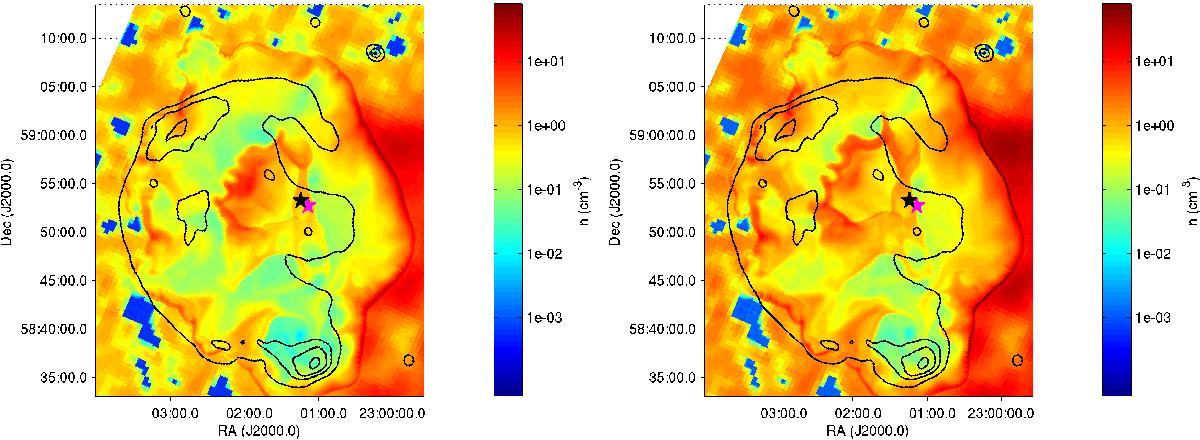
Left: resulting density distribution from the model fit after 8000 yr for the XMM-Newton data with the 1420-MHz contours of CTB 109 overlaid in black. Right: resulting density distribution from the model fit after 11 000 yr for the Chandra data with the 1420-MHz contours of CTB 109 overlaid in black. The position of the SN explosion is marked with a black star and the position of the AXP with a magenta star.
Current usage metrics show cumulative count of Article Views (full-text article views including HTML views, PDF and ePub downloads, according to the available data) and Abstracts Views on Vision4Press platform.
Data correspond to usage on the plateform after 2015. The current usage metrics is available 48-96 hours after online publication and is updated daily on week days.
Initial download of the metrics may take a while.