Fig. 2
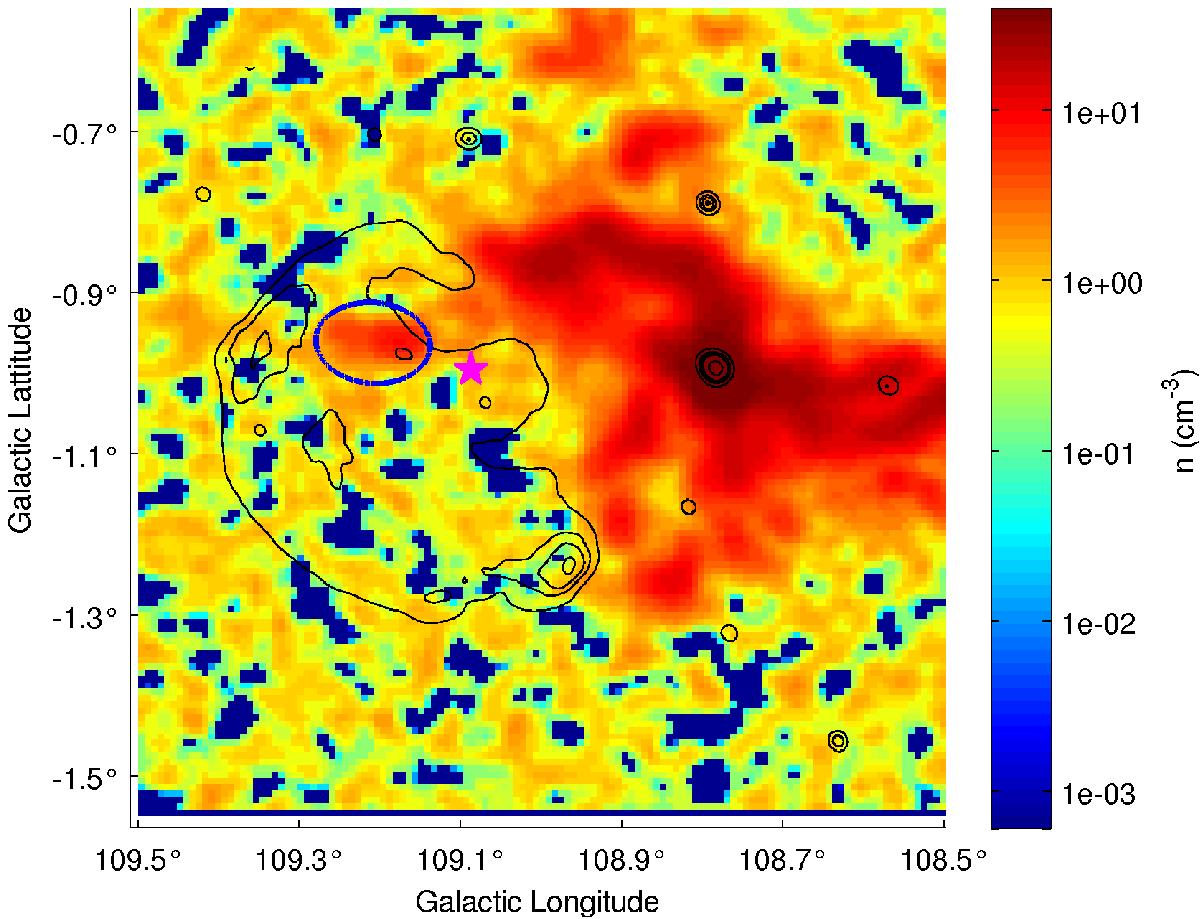
Density structure of CTB 109, obtained by converting the mean 12CO emission in the eastern part with n0 = 0.155 cm-3 from XMM-Newton data. Overlaid black contour lines display the 1420-MHz continuum emission for 8 K, 15 K, 21 K, 29 K, and 100 K (Tian et al. 2010). The current position of the associated AXP 1E 2259+586 is marked with a magenta star. The circumference of a foreground cloud fragment, which was removed for the calculations, is marked as a blue ellipse.
Current usage metrics show cumulative count of Article Views (full-text article views including HTML views, PDF and ePub downloads, according to the available data) and Abstracts Views on Vision4Press platform.
Data correspond to usage on the plateform after 2015. The current usage metrics is available 48-96 hours after online publication and is updated daily on week days.
Initial download of the metrics may take a while.