Fig. 1
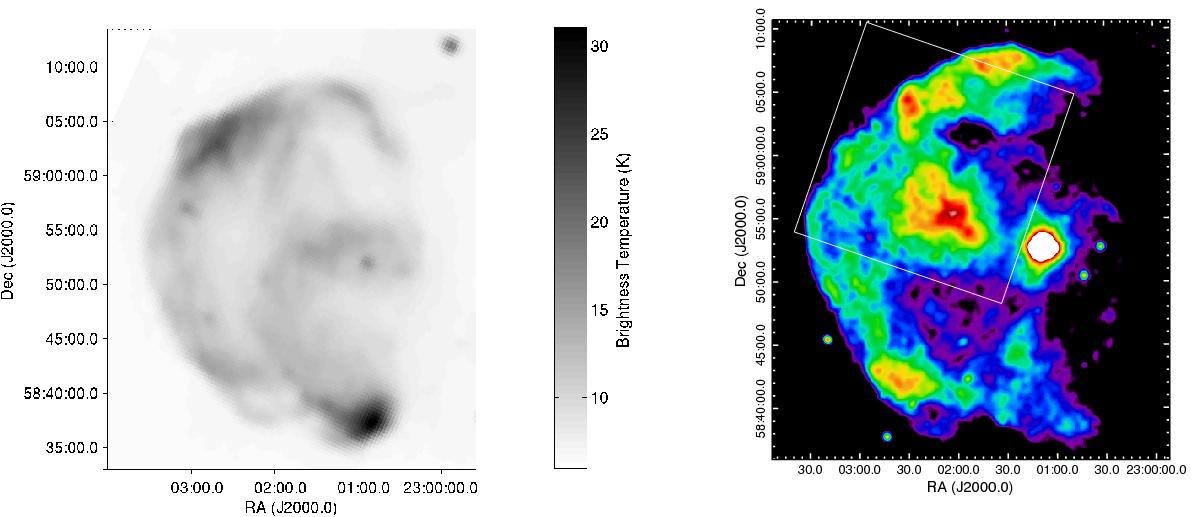
Left: 1420-MHz radio continuum image of CTB 109 (Kothes et al. 2002) from the Canadian Galactic Plane Survey (CGPS, Taylor et al. 2003). Right: intensity map (0.3−4.0 keV) of CTB 109 in false colour from the XMM-Newton EPIC data (Sasaki et al. 2004). The very bright point source is the AXP 1E 2259+586 and the diffuse emission at RA = 2302, Dec =+ 58°55′ (J2000.0) with an extent of ~7′ is the Lobe. Chandra’s field of view is marked as a white rectangle.
Current usage metrics show cumulative count of Article Views (full-text article views including HTML views, PDF and ePub downloads, according to the available data) and Abstracts Views on Vision4Press platform.
Data correspond to usage on the plateform after 2015. The current usage metrics is available 48-96 hours after online publication and is updated daily on week days.
Initial download of the metrics may take a while.