Fig. 9
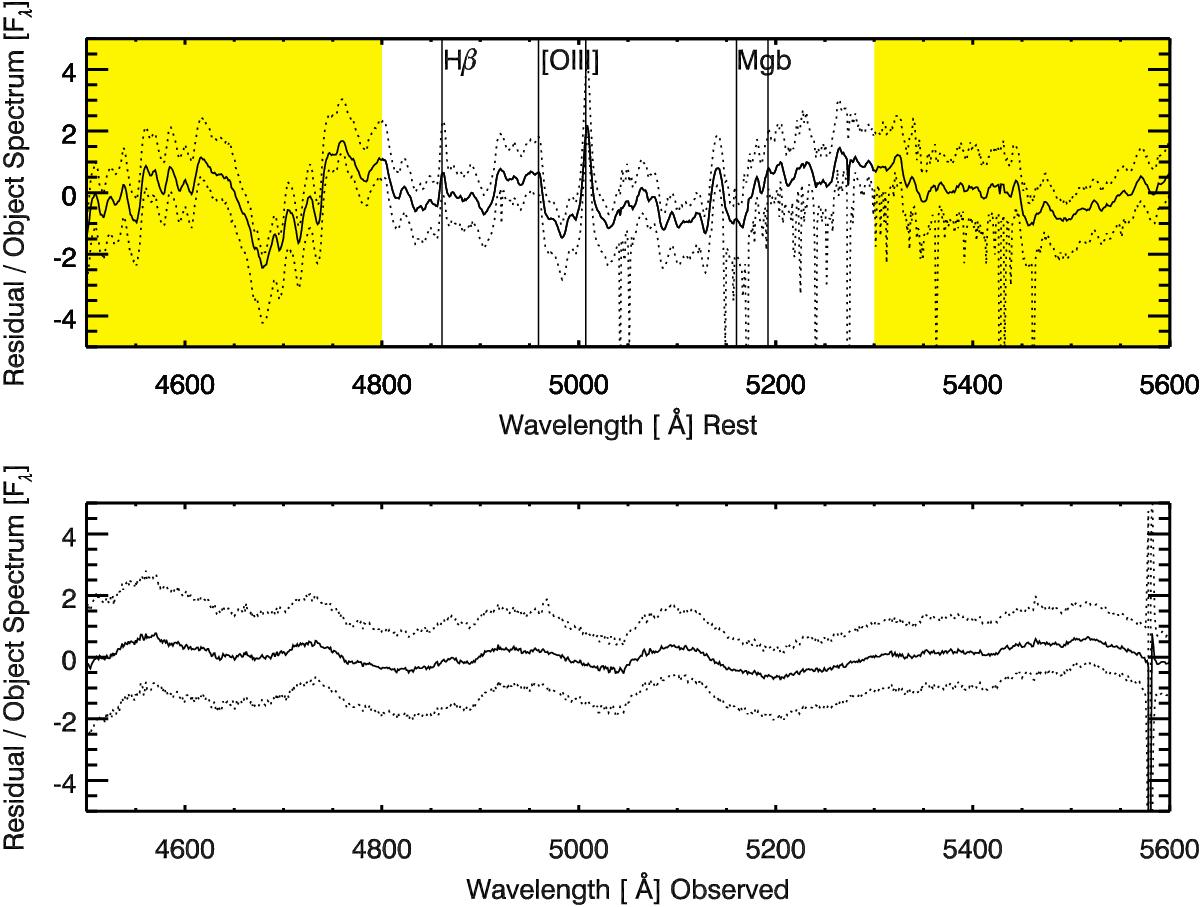
Mean residual vector and its standard deviation from all galaxies in the sample. The upper plot indicates the residuals in the rest frame of the galaxies, the yellow region has actually not been used to determine the best fit. [OIII] and Hβ emission lines are labelled and clearly visible. The Mgb feature is also indicated for reference, but does not show evidence of specific mismatch. The lower plot shows the observed frame residuals indicating no major concern with the data.
Current usage metrics show cumulative count of Article Views (full-text article views including HTML views, PDF and ePub downloads, according to the available data) and Abstracts Views on Vision4Press platform.
Data correspond to usage on the plateform after 2015. The current usage metrics is available 48-96 hours after online publication and is updated daily on week days.
Initial download of the metrics may take a while.