Fig. 18
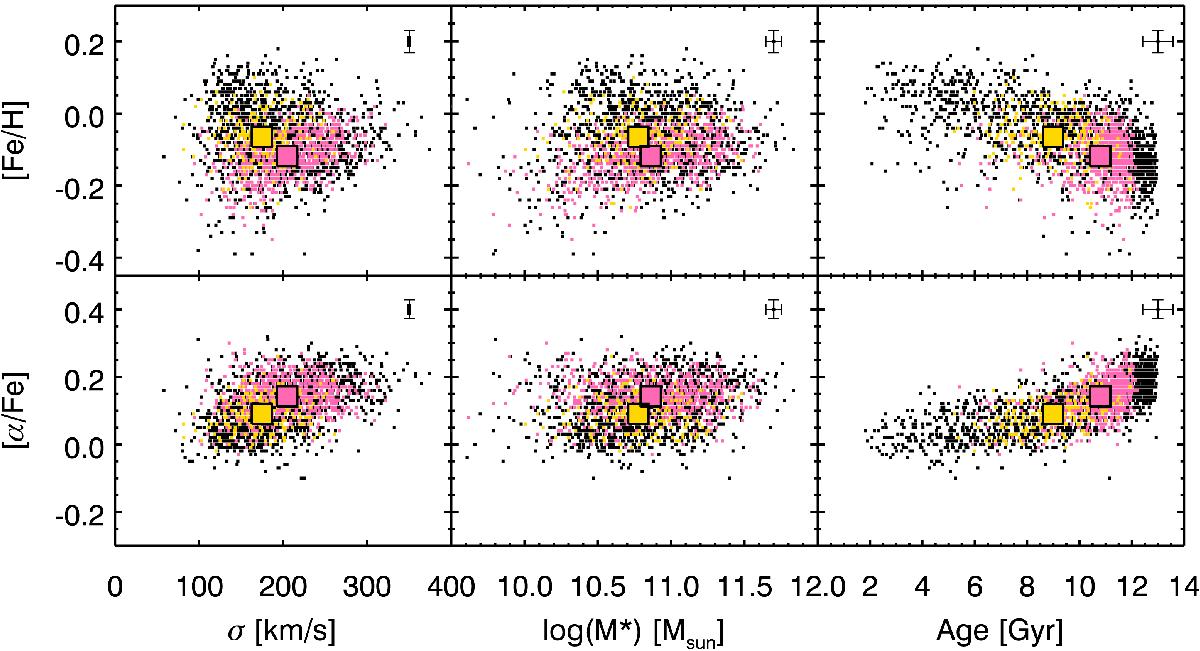
Correlations of [Fe/H] and [α/Fe] with velocity dispersion, stellar mass and mean light-weighted age for our sample galaxies (same as Fig. 12). Colors reproduce the classification from Fig. 17 into SLF-ETGs (yellow) and ACC-ETGs (pink). The mean for each subpopulation is also shown as a large square with black borders. Galaxies that could not be reliably classified are shown as black dots.
Current usage metrics show cumulative count of Article Views (full-text article views including HTML views, PDF and ePub downloads, according to the available data) and Abstracts Views on Vision4Press platform.
Data correspond to usage on the plateform after 2015. The current usage metrics is available 48-96 hours after online publication and is updated daily on week days.
Initial download of the metrics may take a while.