Fig. 17
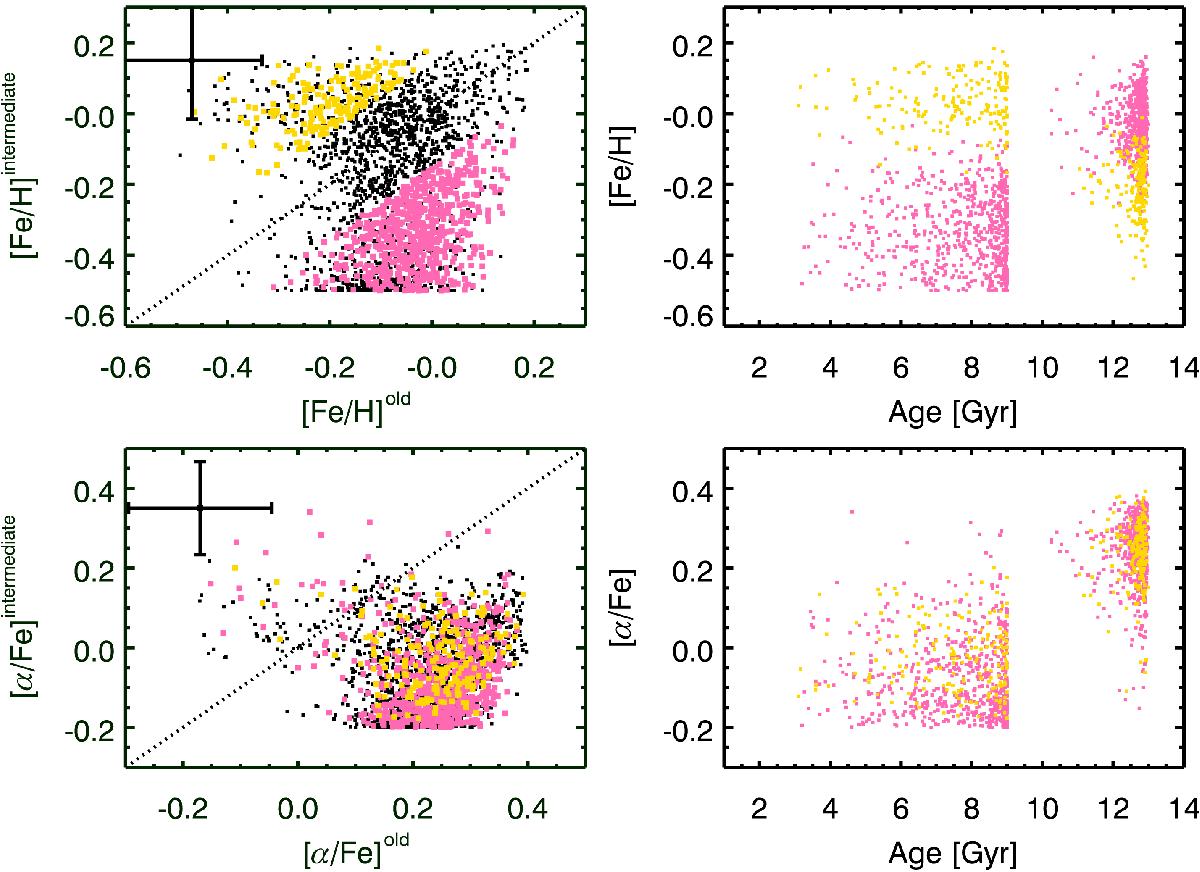
Left panels: distribution of mean light-weighted [Fe/H] and [α/Fe] for the old vs. intermediate sub-populations. Galaxies in yellow are those where [Fe/H]o< [Fe/H]i−0.15 (SLF-ETGs), pink where [Fe/H]o> [Fe/H]i+0.15 (ACC-ETGs). Galaxies with uncertain classification are shown in black. Average uncertainties including all degeneracies are shown in the upper left corners. Right panels: age dependence of [Fe/H] and [α/Fe] within each galaxy, i.e. their enrichment history. Galaxies with uncertain classification have been omitted for clarity.
Current usage metrics show cumulative count of Article Views (full-text article views including HTML views, PDF and ePub downloads, according to the available data) and Abstracts Views on Vision4Press platform.
Data correspond to usage on the plateform after 2015. The current usage metrics is available 48-96 hours after online publication and is updated daily on week days.
Initial download of the metrics may take a while.