Fig. 9
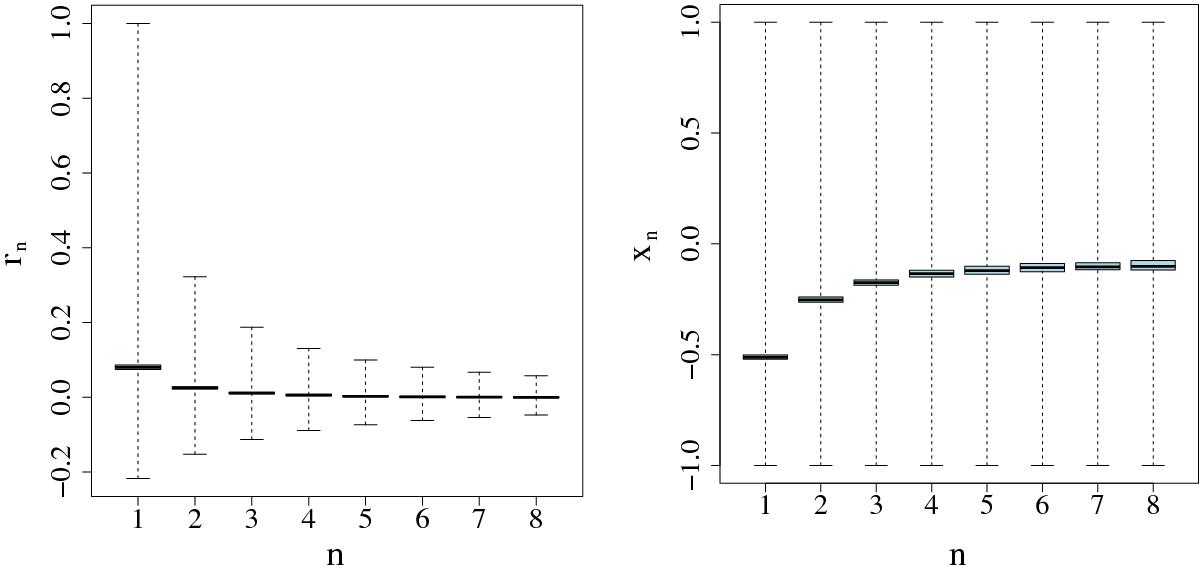
Box-and-whisker plots for the correlation coefficients rn and the transformed values xn, as defined in Eq. (7), where each data point shows the upper and lower quartile (edges of the box), median (line inside the box), and mean upper and lower boundaries (whiskers) for the 125 realizations measured from the simulation subcubes. These use the same lags, random catalog size, and estimator as before (see text and previous figure captions for details).
Current usage metrics show cumulative count of Article Views (full-text article views including HTML views, PDF and ePub downloads, according to the available data) and Abstracts Views on Vision4Press platform.
Data correspond to usage on the plateform after 2015. The current usage metrics is available 48-96 hours after online publication and is updated daily on week days.
Initial download of the metrics may take a while.