Fig. 8
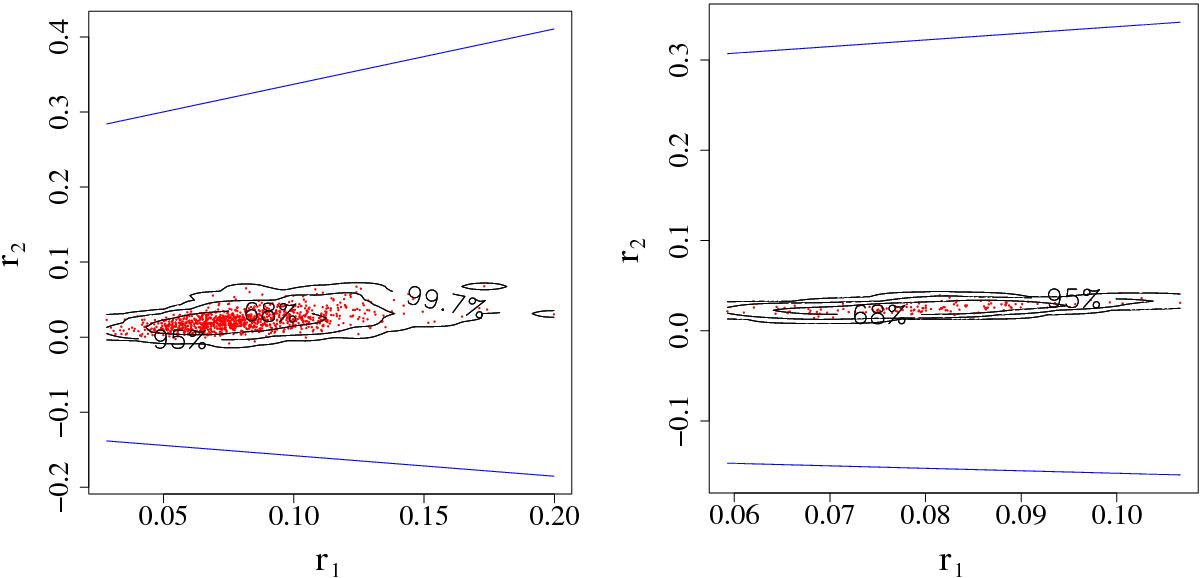
Correlation coefficients r1 and r2 measured from the halo catalogs in the subcubes of the Millennium Simulation, using the LS estimator, where we slice the simulation volume into 1000 subcubes for the left panel and 125 for the right one, and the random catalog for each subcube contains 5000 halos. In both cases, we measure ξ at lags of separation Δs = 5 h-1Mpc, and use all halo pairs with pair separations of 0 to 2 h-1Mpc to compute ξ0. The red dots show the 1000 (125) realizations, while the black lines are iso-density contours that contain the given percentages of the realizations. The upper and lower constraints r2u,l(r1), computed individually for each realization of r1, are shown as blue lines.
Current usage metrics show cumulative count of Article Views (full-text article views including HTML views, PDF and ePub downloads, according to the available data) and Abstracts Views on Vision4Press platform.
Data correspond to usage on the plateform after 2015. The current usage metrics is available 48-96 hours after online publication and is updated daily on week days.
Initial download of the metrics may take a while.