Fig. 7
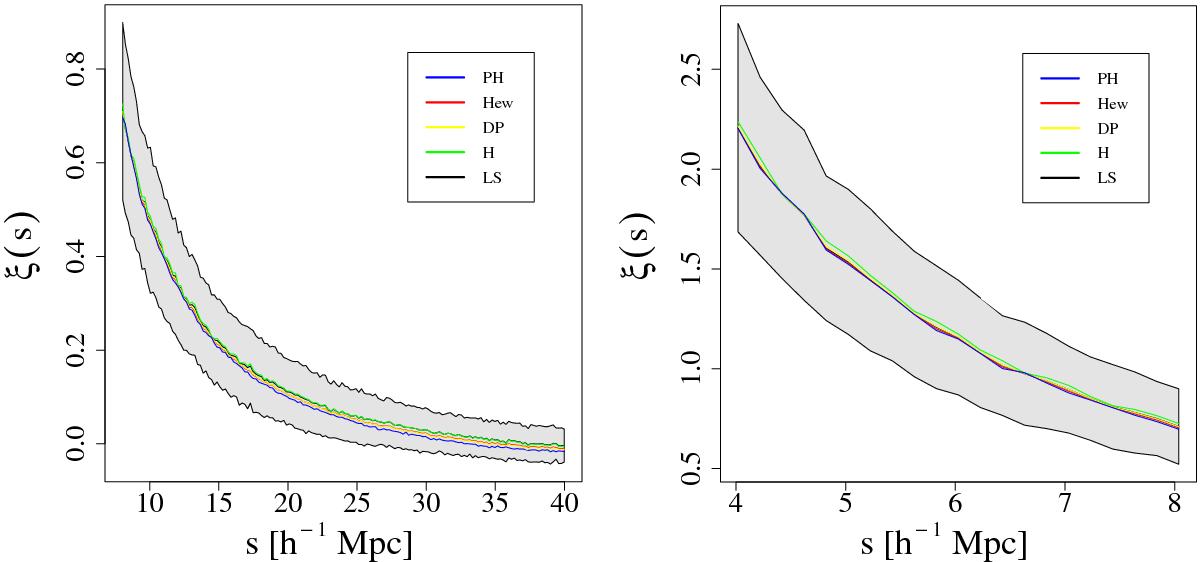
Correlation function measured for “all” lags (see text for details) as a function of the pair separation s, with a random catalog size of Nrand = 5000. The lines denote the mean ξ(s) measured in the 125 subcubes using the different estimators listed in , and the gray shaded region shows the standard deviation. In the left panel, the s-range from 8 to 40 h-1Mpc is plotted, and the right panel shows the results for very small lags, from 4 to 8 h-1Mpc.


Current usage metrics show cumulative count of Article Views (full-text article views including HTML views, PDF and ePub downloads, according to the available data) and Abstracts Views on Vision4Press platform.
Data correspond to usage on the plateform after 2015. The current usage metrics is available 48-96 hours after online publication and is updated daily on week days.
Initial download of the metrics may take a while.