Fig. 6
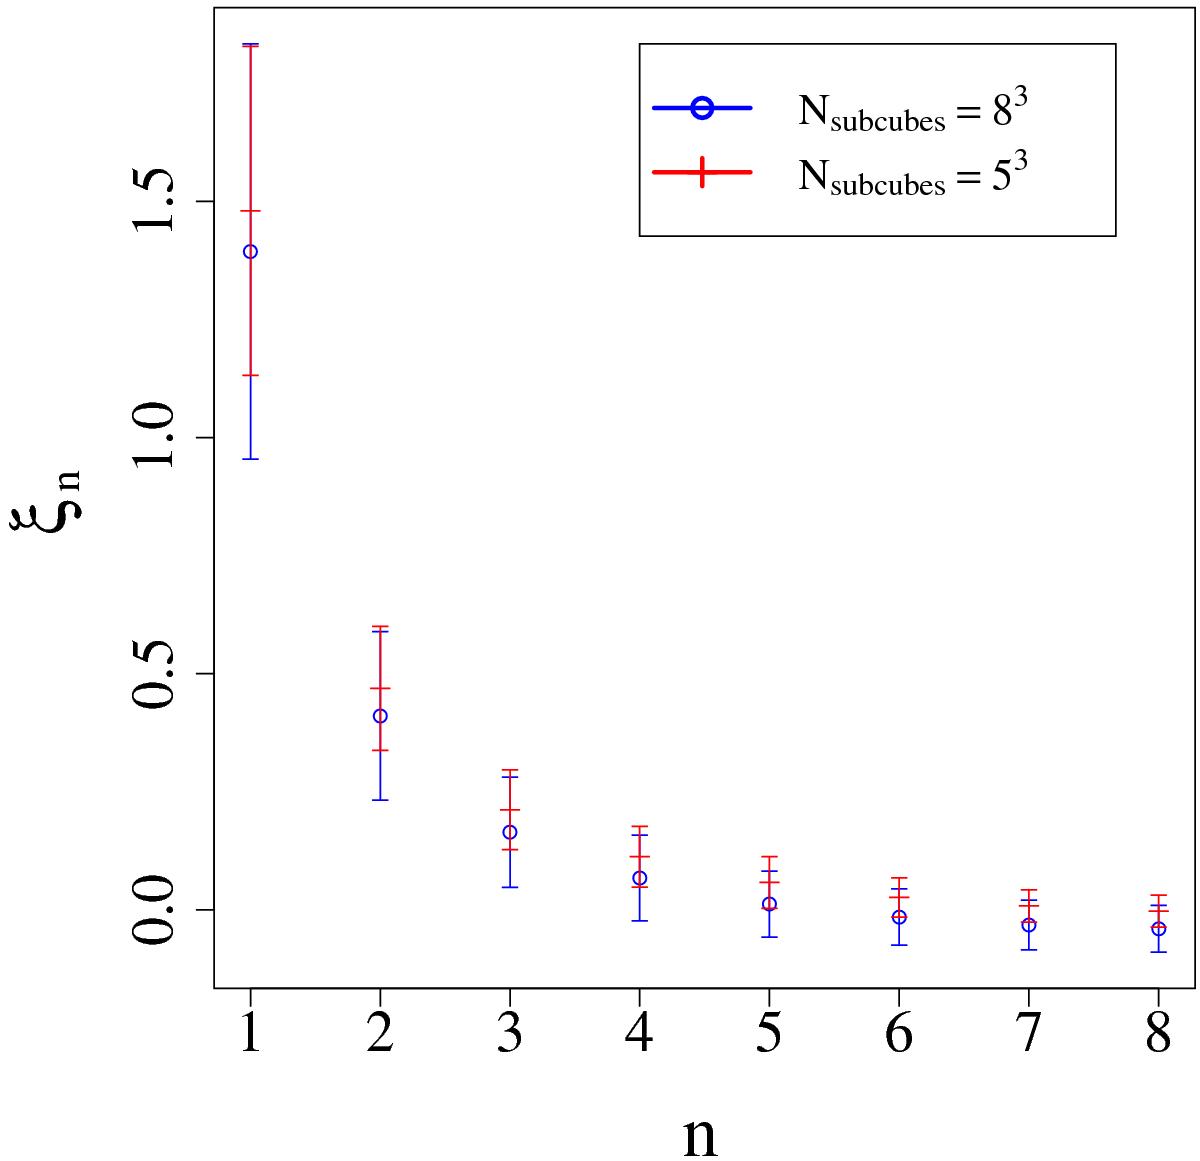
Correlation function from the Millennium Simulation, computed using the LS estimator, a random catalog size of 5000, and a lag separation of Δs = 5 h-1Mpc. The points and error bars show the mean and standard deviation computed over the subcubes of the simulation, where the simulation box was sliced into 83 subcubes for the blue data points, as opposed to 53 for the red ones.
Current usage metrics show cumulative count of Article Views (full-text article views including HTML views, PDF and ePub downloads, according to the available data) and Abstracts Views on Vision4Press platform.
Data correspond to usage on the plateform after 2015. The current usage metrics is available 48-96 hours after online publication and is updated daily on week days.
Initial download of the metrics may take a while.