Fig. 4
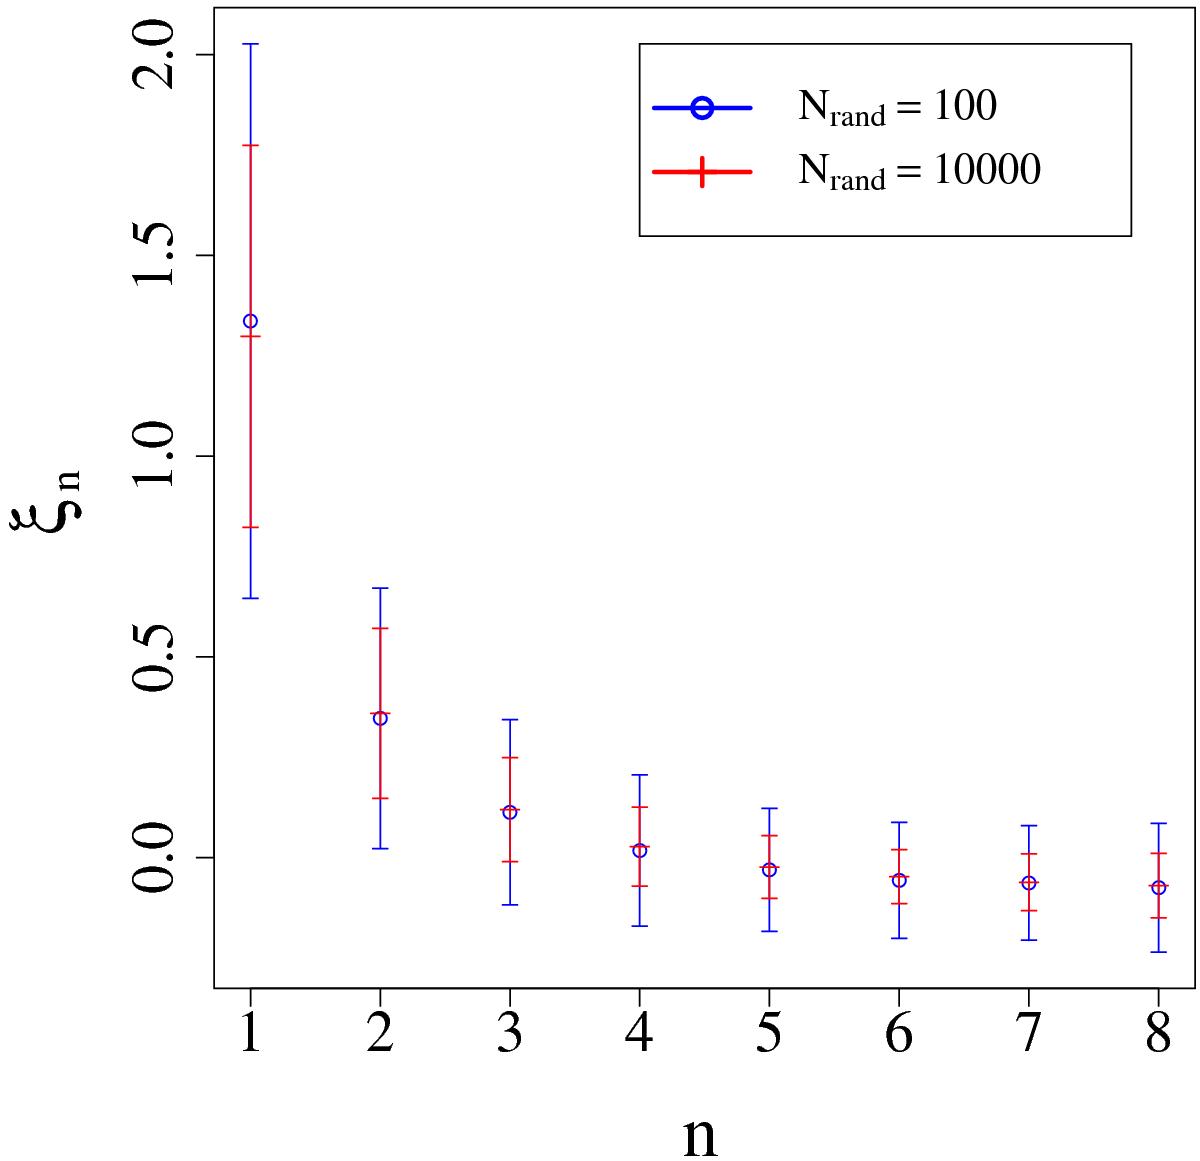
Correlation function from 1000 subcubes of the Millennium Simulation, computed using the LS estimator. The points and error bars show the correlation function ξn ≡ ξ(n·Δs) for Δs = 5 h-1Mpc (see text for details) averaged over the 1000 subcubes of side length 50 h-1Mpc, as well as the standard deviation. For the blue circles, the random catalog for each subcube contains 100 halos, as opposed to 10 000 halos for the red crosses.
Current usage metrics show cumulative count of Article Views (full-text article views including HTML views, PDF and ePub downloads, according to the available data) and Abstracts Views on Vision4Press platform.
Data correspond to usage on the plateform after 2015. The current usage metrics is available 48-96 hours after online publication and is updated daily on week days.
Initial download of the metrics may take a while.