Fig. 3
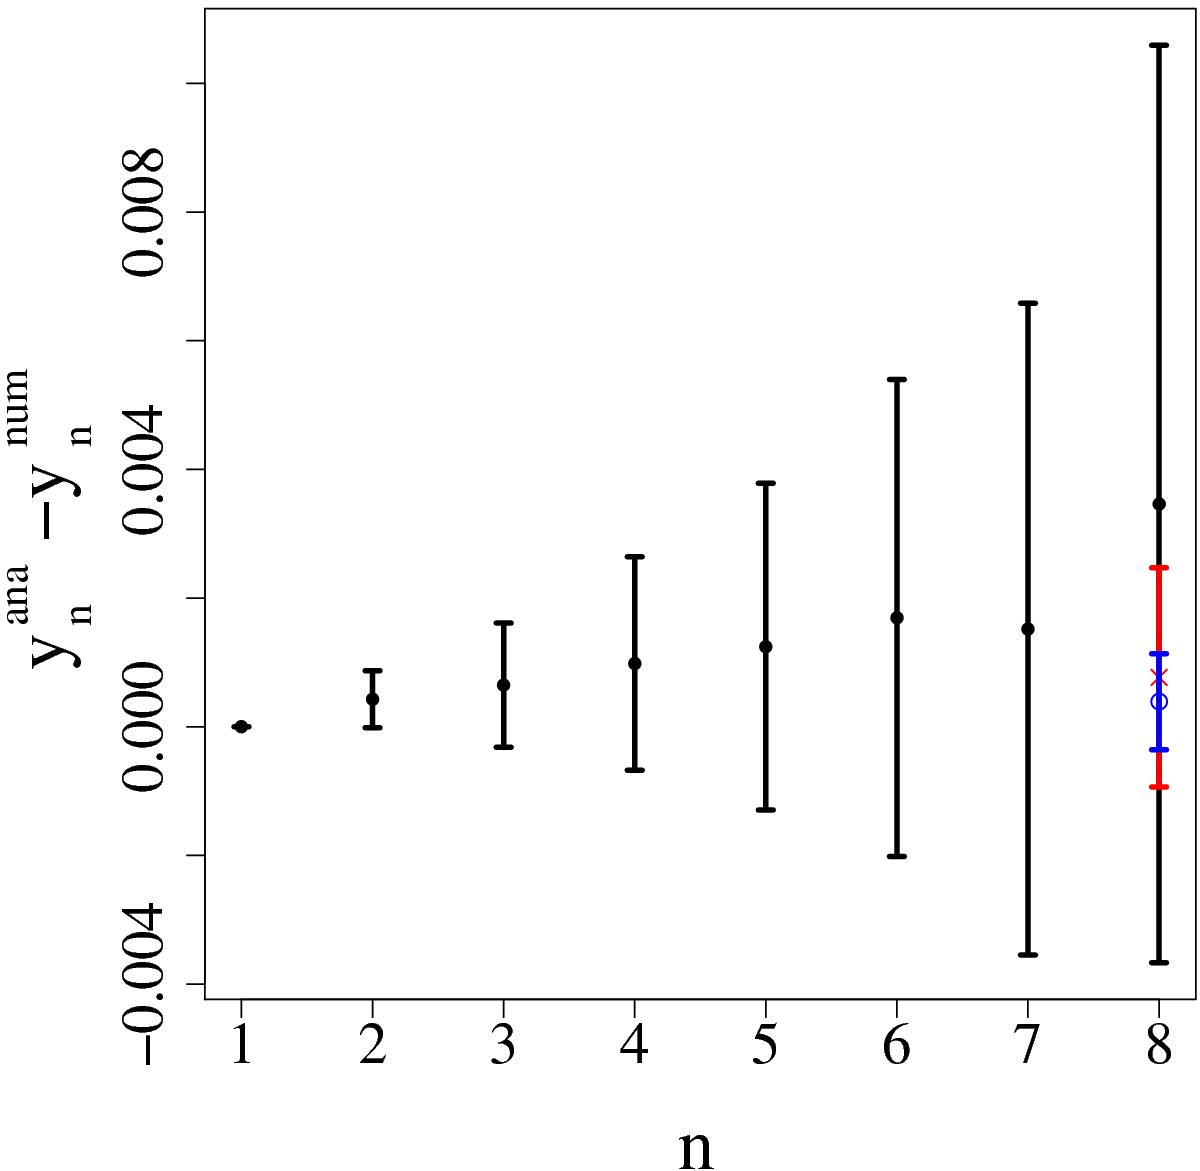
Difference between the yn computed using the analytically and the numerically obtained bounds, averaged over 500 realizations, with error bars showing the standard deviations. The input values for the computation of the bounds used in the transformation rn → yn stem from 500 simulated realizations of the correlation function on a one-dimensional Gaussian field of length L with N = 32 grid points and a Gaussian power spectrum of width k0, with Lk0 = 80. In the case of the black, solid points, the convex hull of the curve c(λ) is sampled using 100 points for the range 0 ≤ λ ≤ 2π. By way of comparison, we show the corresponding results for sampling rates of 200 (red cross) and 300 (blue circle) in the case n = 8.
Current usage metrics show cumulative count of Article Views (full-text article views including HTML views, PDF and ePub downloads, according to the available data) and Abstracts Views on Vision4Press platform.
Data correspond to usage on the plateform after 2015. The current usage metrics is available 48-96 hours after online publication and is updated daily on week days.
Initial download of the metrics may take a while.