Fig. 2
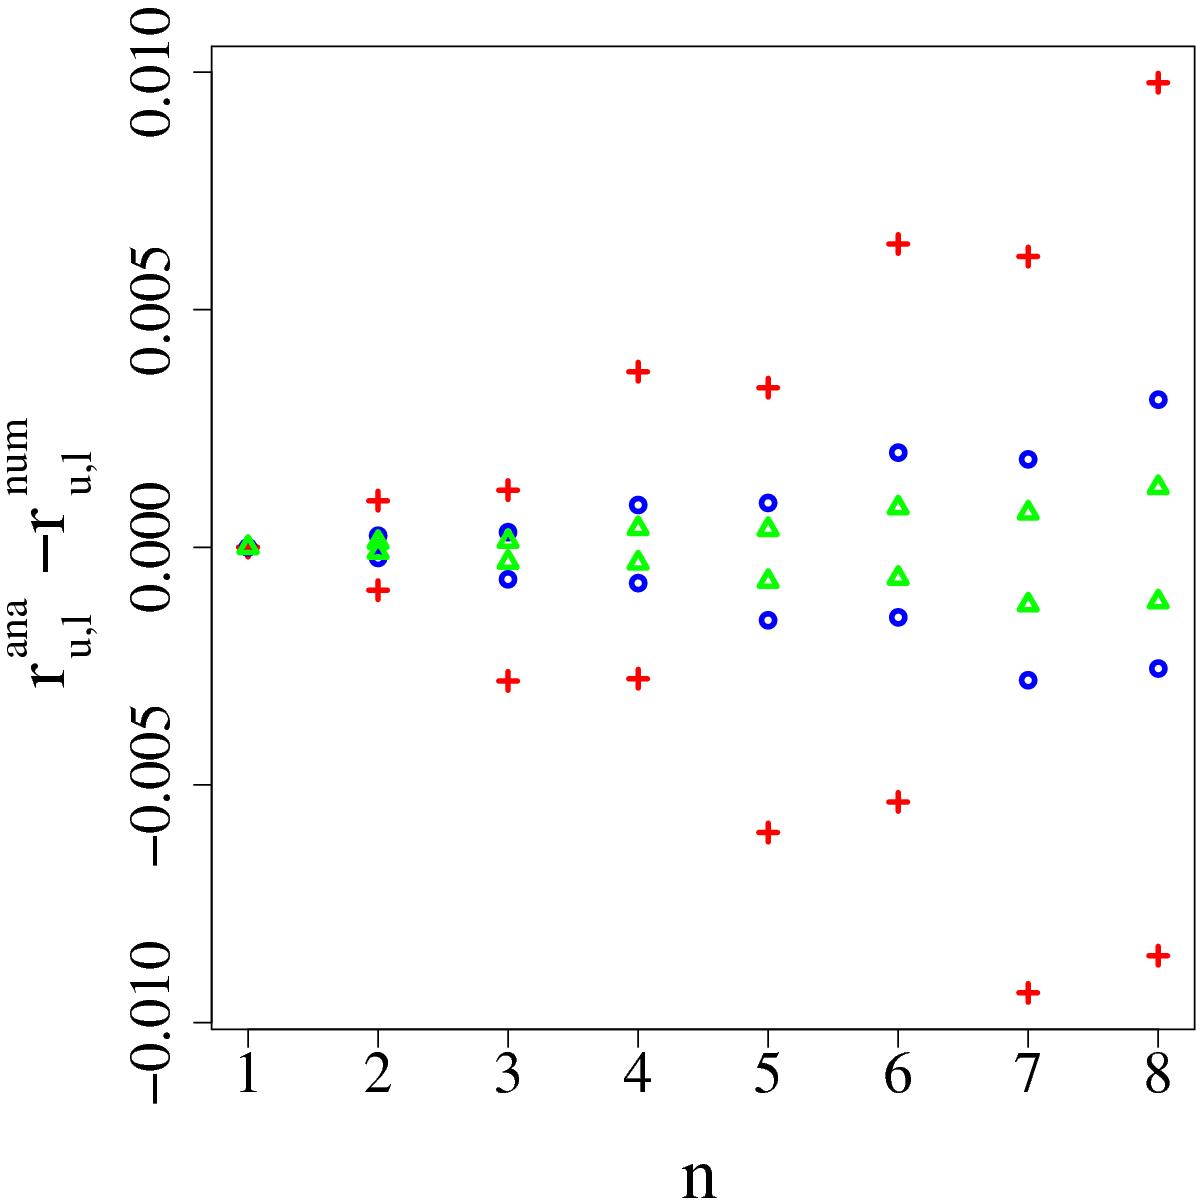
Difference between the analytically and numerically obtained bounds, averaged over 500 realizations. The upper three sets of points correspond to the difference ![]() , whereas the ones with negative values show
, whereas the ones with negative values show ![]() . Furthermore, the different symbols denote the number of steps used to sample the convex hull of the curve c(λ) for values of 0 ≤ λ ≤ 2π, namely 100 (red crosses), 200 (blue circles), and 300 (green triangles) steps.
. Furthermore, the different symbols denote the number of steps used to sample the convex hull of the curve c(λ) for values of 0 ≤ λ ≤ 2π, namely 100 (red crosses), 200 (blue circles), and 300 (green triangles) steps.
Current usage metrics show cumulative count of Article Views (full-text article views including HTML views, PDF and ePub downloads, according to the available data) and Abstracts Views on Vision4Press platform.
Data correspond to usage on the plateform after 2015. The current usage metrics is available 48-96 hours after online publication and is updated daily on week days.
Initial download of the metrics may take a while.