Fig. 12
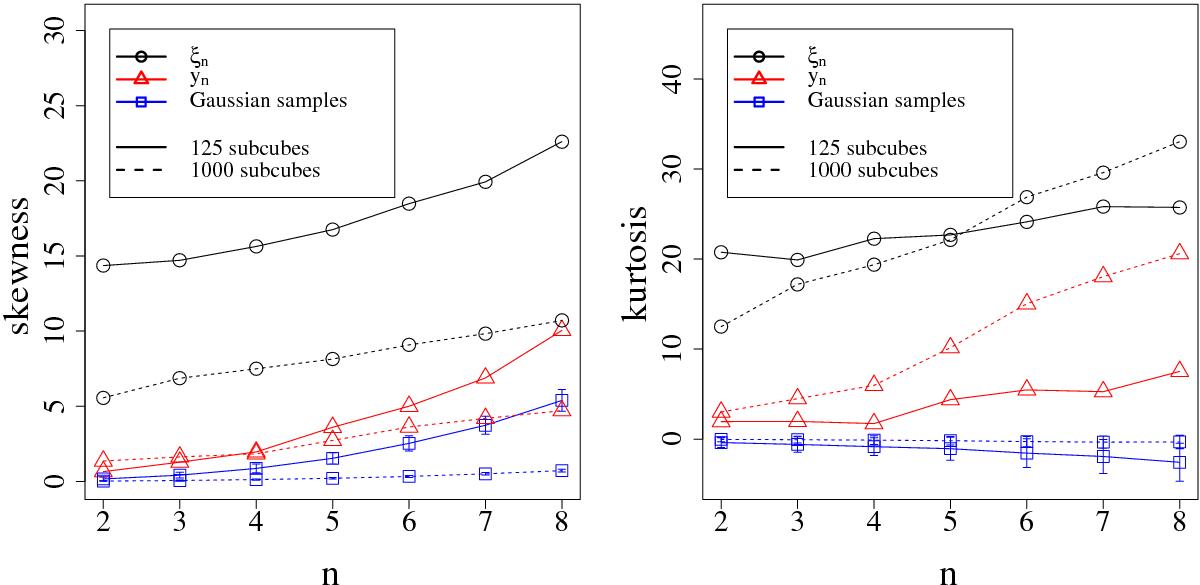
Multivariate Mardia’s skewness and kurtosis of the n-variate distributions of the { ξ }- and { y }-samples, obtained from the Millennium Simulation, and of corresponding Gaussian samples, using the same parameters as before (see previous figure caption). In contrast to the previous figure, we plot two curves for Gaussian samples: for the solid (dashed) curve, we draw Gaussian samples with the same mean, covariance matrix, and sample size as the corresponding distributions in y-space for the case of 125 (1000) subcubes; the blue squares and error bars show the mean and standard deviation of the skewness and kurtosis of the 100 samples.
Current usage metrics show cumulative count of Article Views (full-text article views including HTML views, PDF and ePub downloads, according to the available data) and Abstracts Views on Vision4Press platform.
Data correspond to usage on the plateform after 2015. The current usage metrics is available 48-96 hours after online publication and is updated daily on week days.
Initial download of the metrics may take a while.