Fig. 11
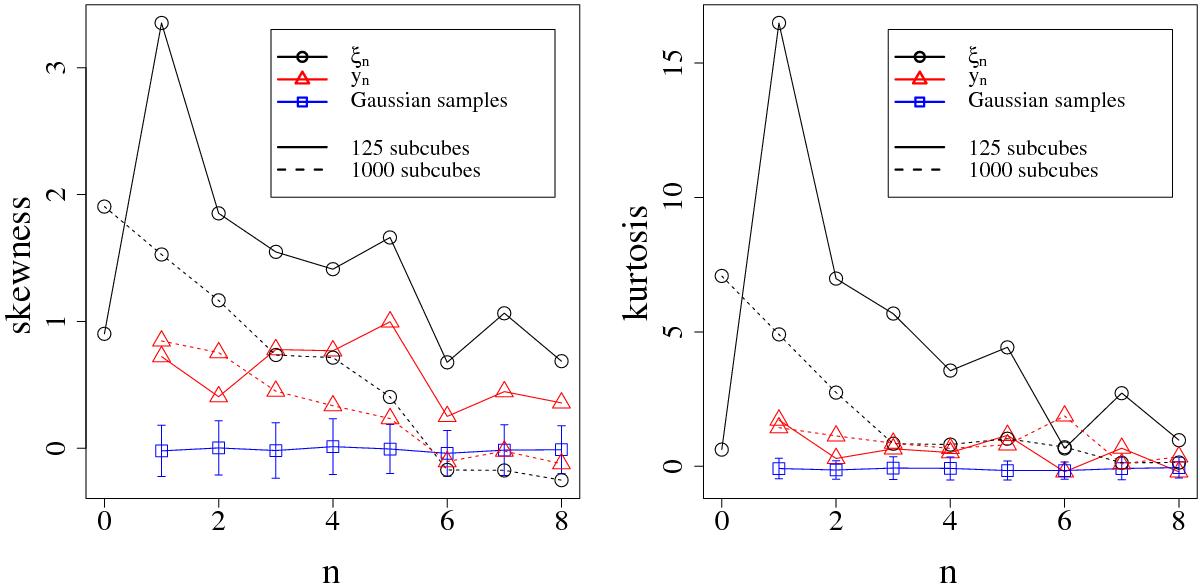
Test for the univariate Gaussianity of the { ξ }- and { y }-samples obtained from the Millennium Simulation, using a lag separation of Δs = 5 h-1Mpc and bin widths of 1 h-1Mpc for all ξn, including ξ0. The black circles and red triangles show the univariate skewness and kurtosis of the distributions p(ξn) and p(yn), computed over 125 (solid curves) and 1000 (dashed curves) subcubes of the simulation volume. For the blue curves, we draw 100 Gaussian samples with the same mean, covariance matrix and sample size as the distributions p(yn) in the case of 125 subcubes, and plot the mean and standard deviation of their skewness and kurtosis.
Current usage metrics show cumulative count of Article Views (full-text article views including HTML views, PDF and ePub downloads, according to the available data) and Abstracts Views on Vision4Press platform.
Data correspond to usage on the plateform after 2015. The current usage metrics is available 48-96 hours after online publication and is updated daily on week days.
Initial download of the metrics may take a while.