Fig. 10
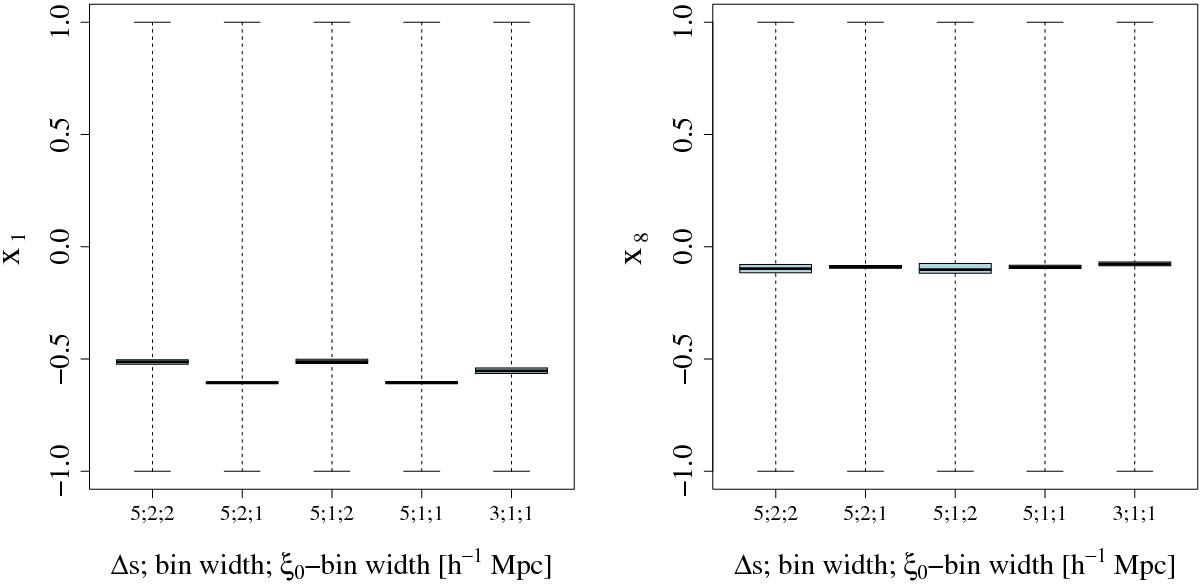
Box-and-whisker plots of the transformed correlation coefficients at smallest and largest lag for varying lag separation and bin width. The triple labeling of each distribution gives the lag separation Δs, the bin width of pair separations at non-zero lag (i.e., for ξ1...ξ8), and the width of the ξ0-bin. For example, for the second case shown in each panel, we measure ξ0 from halo pairs with separations from 0 to 1 h-1Mpc, ξ1 from those with separations from 4 to 6 h-1Mpc, ξ2 from 9 to 11 h-1Mpc, and so on.
Current usage metrics show cumulative count of Article Views (full-text article views including HTML views, PDF and ePub downloads, according to the available data) and Abstracts Views on Vision4Press platform.
Data correspond to usage on the plateform after 2015. The current usage metrics is available 48-96 hours after online publication and is updated daily on week days.
Initial download of the metrics may take a while.