Fig. 7
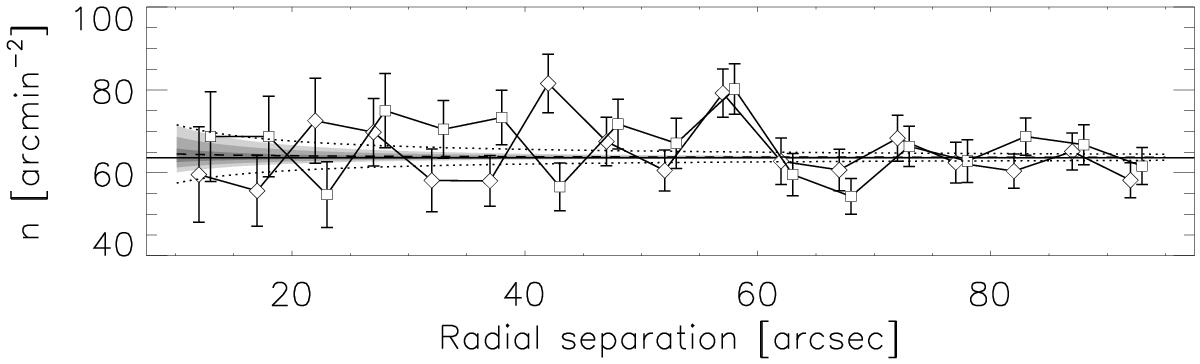
Variations in galaxy number density n as a function of radial distance from the lens positions, using the X-ray peaks (diamonds) and BGG positions (squares). Data points are slightly offset for clarity. Overplotted is the average number density of ~64 galaxies/arcmin2 of the whole ACS mosaic (black solid line) and the best-fit radial profile (dashed) with 1σ errors (dotted). The estimated effect of the lensing magnification, μα−1, is shown in grayscale, varying the slope of the luminosity function between 0 <α< 3. Different shades in grayscale correspond to steps of 0.5 × 10¹⁴ in group mass M200.
Current usage metrics show cumulative count of Article Views (full-text article views including HTML views, PDF and ePub downloads, according to the available data) and Abstracts Views on Vision4Press platform.
Data correspond to usage on the plateform after 2015. The current usage metrics is available 48-96 hours after online publication and is updated daily on week days.
Initial download of the metrics may take a while.