Open Access
Fig. 4
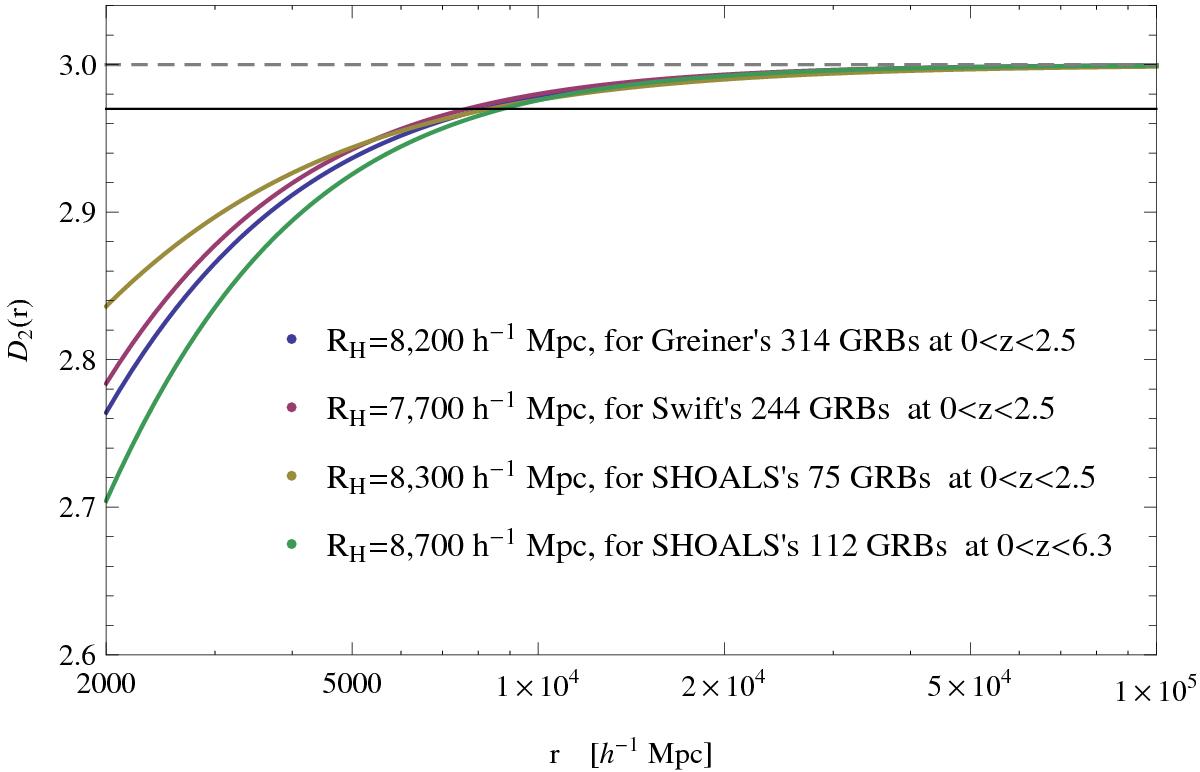
Correlation dimension, D2(r), for different GRB samples. The D2(r) calculated from Eq. (18) is shown in solid lines. The dashed line indicates the critical value defined for the transition from a homogeneous to an inhomogeneous distribution of the GRBs, i.e. 1% from the homogeneity, D2(r) = 2.97.
Current usage metrics show cumulative count of Article Views (full-text article views including HTML views, PDF and ePub downloads, according to the available data) and Abstracts Views on Vision4Press platform.
Data correspond to usage on the plateform after 2015. The current usage metrics is available 48-96 hours after online publication and is updated daily on week days.
Initial download of the metrics may take a while.