Fig. 2
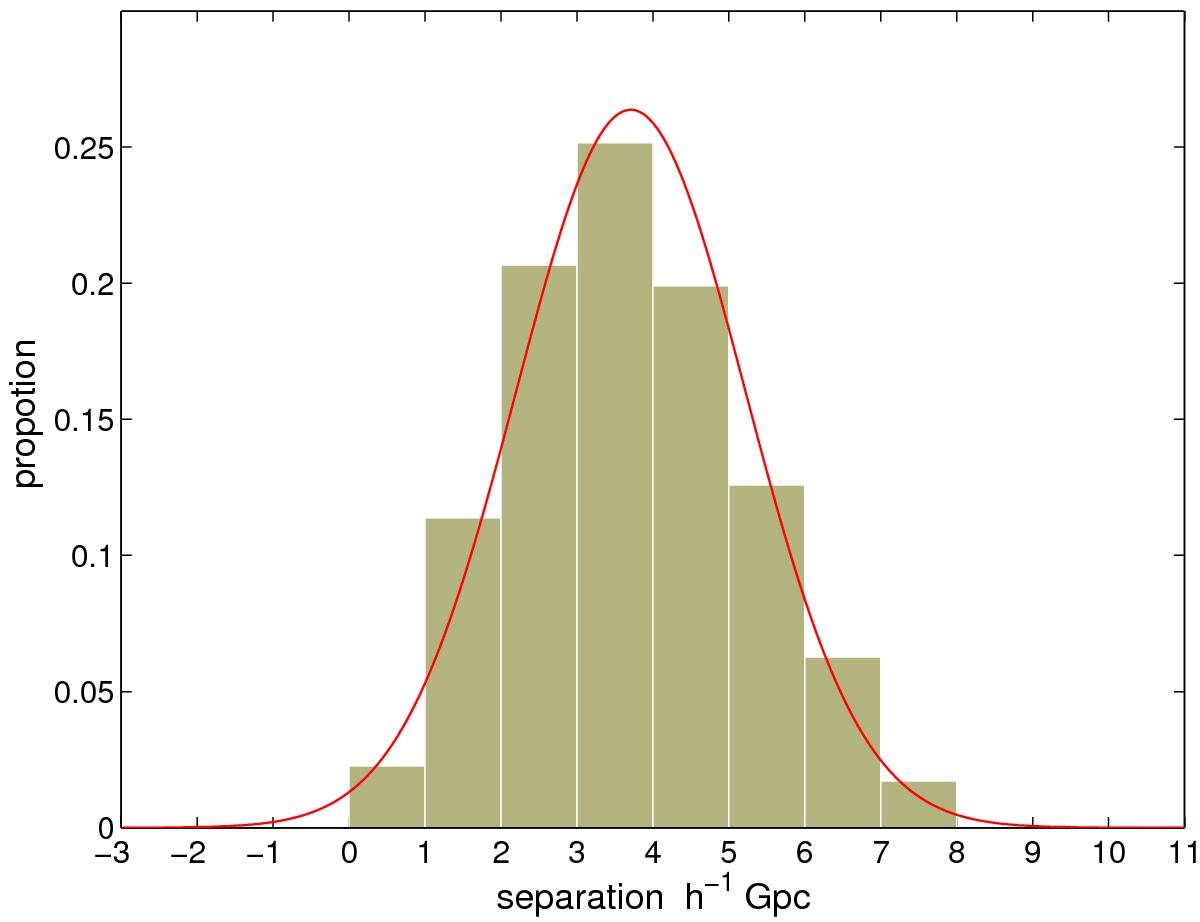
Distribution of the comoving separations d between the GRBs in the Greiner sample (including the Swift subsample of 244 GRBs and most of the SHOALS GRBs). The x-axis is the comoving separation of the GRB data, in units of h-1 Gpc. The y-axis is the proportion of the GRB number in each bin to the whole sample, which has been normalized to 1. The separation d obeys a Gaussian distribution with the expectation value ![]() Mpc.
Mpc.
Current usage metrics show cumulative count of Article Views (full-text article views including HTML views, PDF and ePub downloads, according to the available data) and Abstracts Views on Vision4Press platform.
Data correspond to usage on the plateform after 2015. The current usage metrics is available 48-96 hours after online publication and is updated daily on week days.
Initial download of the metrics may take a while.