Fig. 1
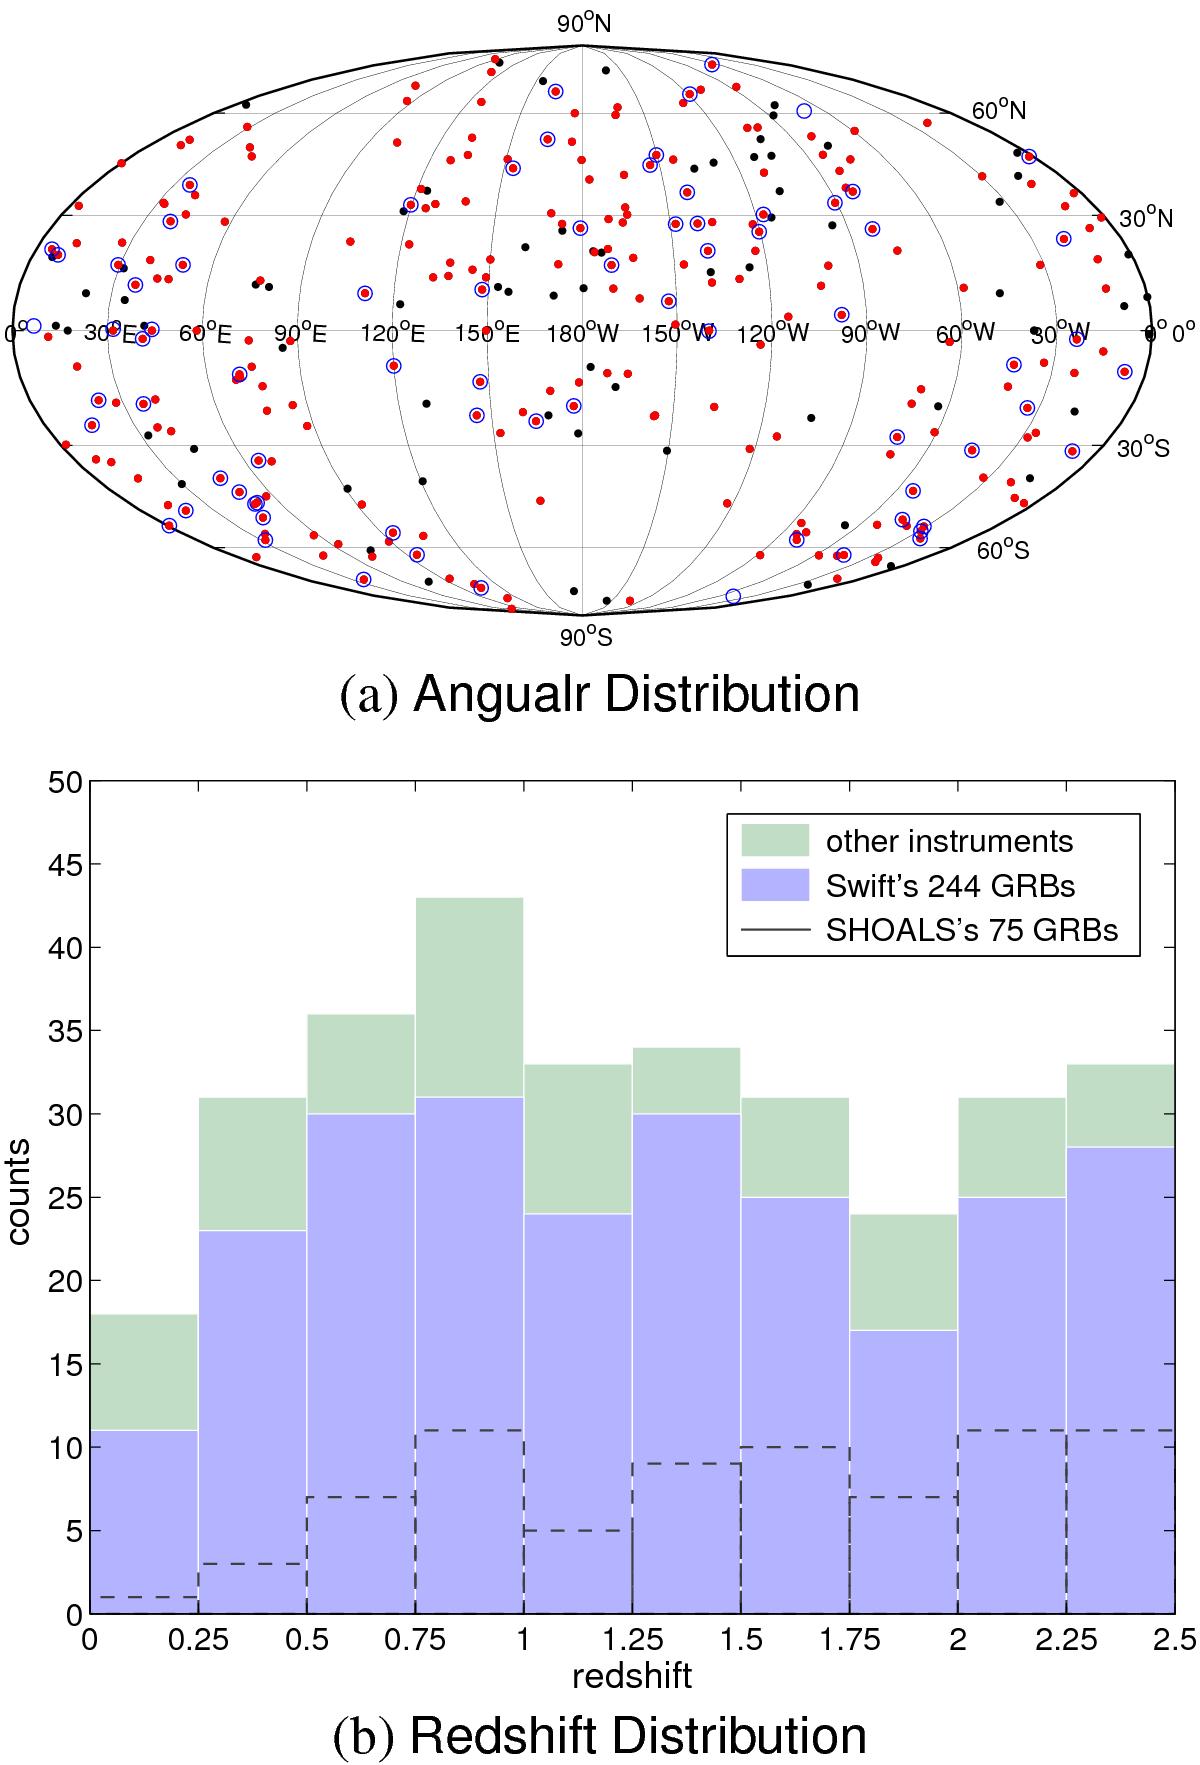
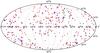
Angular and redshift distributions of the GRB samples. a) The angular distribution of the GRB samples in J.2000 equatorial coordinates. The red solid dots represent the 244 GRBs at 0 < z < 2.5 detected by Swift, while the black solid dots represent those discovered by other detectors within the same redshift range. The red and black solid dots constitute Greiner’s GRB sample of 314 objects at 0 < z < 2.5. The blue circles represent the 112 GRBs (at 0 < z < 6.3) from SHOALS. b) The redshift distribution of the GRB data. The y-axis denotes the number of objects in each redshift bin. The green shaded area plus the purple area indicates the total of 314 GRBs from the Greiner sample. The dashed line represents the contribution from the SHOALS subsample of 75 objects at 0 < z < 2.5.
Current usage metrics show cumulative count of Article Views (full-text article views including HTML views, PDF and ePub downloads, according to the available data) and Abstracts Views on Vision4Press platform.
Data correspond to usage on the plateform after 2015. The current usage metrics is available 48-96 hours after online publication and is updated daily on week days.
Initial download of the metrics may take a while.