| Issue |
A&A
Volume 582, October 2015
|
|
|---|---|---|
| Article Number | A53 | |
| Number of page(s) | 9 | |
| Section | Stellar structure and evolution | |
| DOI | https://doi.org/10.1051/0004-6361/201425488 | |
| Published online | 05 October 2015 | |
Detection of a large Be circumstellar disk during X-ray quiescence of XTE J1946+274
1 Department of Physics, Middle East Technical University, 06531 Ankara, Turkey
e-mail: This email address is being protected from spambots. You need JavaScript enabled to view it.
2 Institut de Ciències de l’Espai, (IEEC-CSIC), Campus UAB, Fac. de Ciències, Torre C5 pa., 08193 Barcelona, Spain
3 Instituto de Astrofísica de Canarias, 38200 La Laguna, Tenerife, Spain
4 Universidad de La Laguna, Dept. Astrofísica, 38206 La laguna, Tenerife, Spain
5 Universitad de Valencia, Dept. Didáctica de las Matemática, Avda. Tarongers, 4, 46022 Valencia, Spain
6 Instituto de Astrofísica de Andalucía (CSIC), Glorieta de la Astronomía s/n, 18008 Granada, Spain
7 Observatorio Astronómico de la Univ. de Valencia, C/Catedrático Jose Beltran, 2, 46980 Paterna (Valencia), Spain
8 Nordic Optical Telescope, Apartado 474, 38700 Santa Cruz de La Palma, Spain
9 Department of Astronomy, Oscar Klein Center, Stockholm University, AlbaNova, 10691 Stockholm, Sweden
Received: 8 December 2014
Accepted: 9 August 2015
Abstract
Aims. We present a multiwavelength study of the Be/X-ray binary system XTE J1946+274 with the main goal of better characterizing its behavior during X-ray quiescence. We also aim to shed light on the possible mechanisms which trigger the X-ray activity for this source.
Methods. XTE J1946+274 was observed by Chandra-ACIS during quiescence in 2013 March 12. In addition, this source has been monitored from the ground-based astronomical observatories of El Teide (Tenerife, Spain), Roque de los Muchachos (La Palma, Spain) and Sierra Nevada (Granada, Spain) since 2011 September, and from the TÜBİTAK National Observatory (Antalya, Turkey) since 2005 April. We have performed spectral and photometric temporal analyses in order to investigate the quiescent state and transient behavior of this binary system.
Results. Our optical study revealed that a long mass ejection event from the Be star took place in 2006, lasting for about seven years, and another one is currently ongoing. We also found that a large Be circumstellar disk is present during quiescence, although major X-ray activity is not observed. We made an attempt to explain this by assuming the permanently presence of a tilted (sometimes warped) Be decretion disk. The 0.3−10 keV X-ray spectrum of the neutron star during quiescence was well fitted with either an absorbed black-body or an absorbed power-law models. The main parameters obtained for these models were kT = 1.43 ± 0.17 and Γ = 0.9 ± 0.4 (with NH ~ 2−7 × 1022 cm-2). The 0.3−10 keV flux of the source was ~0.8−1 × 10-12 erg-1 cm-2 s-1. Pulsations were found with Ppulse = 15.757(1) s (epoch MJD 56 363.115) and an rms pulse fraction of 32.1(3)%. The observed X-ray luminosity during quiescent periods was close to that of expected in supersonic propeller regimen.
Key words: accretion, accretion disks / stars: emission-line, Be / X-rays: binaries / pulsars: individual: XTE J1946+274
© ESO, 2015
1. Introduction
The hard X-ray transient XTE J1946+274 is one of the poorly-understood sources among Be/X-ray binaries (BeXRB), although its X-ray behavior have been studied in detail since its discovery with All Sky Monitor (ASM) on board the Rossi X-Ray Timing Explorer (RXTE) in 1998 (Smith & Takeshima 1998). The system showed two main transient X-ray active phases detected with different X-ray satellites between 1998 and 2011. The first and the longest X-ray activity lasted about ~3 yr (between September 1998−August 2001) including 13 consecutive outbursts (Wilson et al. 2003). During the initial outburst of these series, having the peak X-ray flux of ~110 mCrab in 2−60 keV band, it was revealed that the system had an X-ray pulsar with a spin period of 15.83 ± 0.02 s (Smith & Takeshima 1998; Wilson et al. 1998) orbiting around its Be companion with a period of 169.2 days in an 0.33 eccentric orbit (Campana et al. 1999; Wilson et al. 2003). Using optical and IR observations Verrecchia et al. (2002) found a distance for XTE J1946+274 in the range of 8−10 kpc, in agreement with the value of 9.5 ± 2.9 kpc obtained from the X-ray data by Wilson et al. (2003). In addition, the existence of a cyclotron resonance scattering feature (CRSF) at ~35 keV was reported by Heindl et al. (2001) using the 1998 outburst observations of High Energy X-Ray Timing Experiment (HEXTE) and Proportional Counter Array (PCA) on RXTE.
After a ~9 yr quiescence in X-rays, the system underwent a new outburst phase starting on 2010 June 4, reaching a value of 140 mCrab in the 15−50 keV energy band within ~22 days on the Swift/Burst Alert Telescope (BAT) hard X-ray transient monitor (Krimm et al. 2010; Müller et al. 2012). Similar to the previous active phase of the source, the second outburst period was again in a series including an initial giant outburst followed by four fainter outbursts (Camero-Arranz et al. 2010b; Caballero et al. 2010; Nakajima et al. 2010; Müller et al. 2010). The presence of another CRSF at ~25 keV was discovered indicating the variation of cyclotron lines between the different outbursts (Müller et al. 2012).
In general, X-ray active phases of XTE J1946+274 include two outbursts per orbital period that are possible to be produced if the Be disk and the orbital plane are offset (Priedhorsky & Holt 1987). However for XTE J1946+274 the outbursts do not coincide with the time of periastron and apastron passages of the neutron star (NS) that would be expected to happen for similar misaligned Be/X-ray systems (Wilson et al. 2003; Müller et al. 2012, and references therein). Therefore some other additional mechanisms would be responsible for this unique behavior.
The optical/IR counterpart to XTE J1946+274 was discovered by Verrecchia et al. (2002) nearly ~3 yr after the first X-ray activity of the system. It is a relatively faint V = 16.9, reddened B0−1 IV−Ve type star having strong Hα and Hβ emission lines in its spectra suggesting the presence of the decretion disk. Subsequent optical spectroscopic observations revealed the profile variations of Hα emission lines implying the existence of global density perturbations in the disk (Wilson et al. 2003).
In this work we present the results of a long-term multiwavelength campaign of XTE J1946+274. Since this X-ray transient spends most of its life in X-ray quiescent phase, our spectroscopic and photometric data mainly cover these inactive periods between the X-ray brightening phases. These optical/IR data come from our monitoring program on Be/X-ray binaries, which involves several ground-based astronomical observatories. In addition, we used one Chandra-ACIS pointed observation carried out during X-ray quiescence in 2013, and several survey data from different space-borne telescopes to investigate the relation between the X-ray and optical/IR bands.
 |
Fig. 1 Swift/BAT light-curve (15−50 keV) with a bin size equal to 10 d. Tick marks on the segments located above the light-curve denote the times of the Chandra pointing observation (light blue), as well as the optical/IR photometric data from the ground-based telescopes ROTSEIIId (black), IAC80 (dark blue) and TCS (dark red). The optical spectroscopic observations come from OSN (dark red), NOT (blue) and RTT150 (light red; see also Table 2). |
Log of the Chandra-ACIS observation during quiescence period II.
Hα equivalent width (EW) measurements of optical counterpart to XTE J1946+274.
Optical and IR magnitudes of XTE J1946+274 observed with IAC80 and TCS telescopes respectively.
2. Observations and data reduction
2.1. Optical spectroscopic observations
Optical spectroscopic observations of the companion were performed during 2011 April−2014 November with four different telescopes: the Russian-Turkish 1.5-m telescope (RTT150) at the TÜBİTAK National Observatory in Antalya (Turkey), the 2.56-m Nordic Optical Telescope (NOT) located at the Observatorio del Roque de los Muchachos (La Palma, Spain), and the 1.5-m Telescope at the Observatorio de Sierra Nevada (OSN-CSIC) in Granada (Spain). In addition to this long-term observation set we include a spectrum of the source taken in June 2007 with RTT150.
The spectroscopic data from RTT150 were obtained with the TÜBİTAK Faint Object Spectrometer and Camera (TFOSC). It is equipped with a 2048 × 2048, 15 μm pixel Fairchild 447BI CCD whose FOV is 13 3 × 133. We used slit 67 μm (1
 24) with Grism 8 having an average dispersion of 1.1 Å pixel and providing a 5800−8300 Å wavelength coverage. The reduction of RTT150 spectra was done using the Long-Slit package of MIDAS1. Bias correction, flat-fielding and removal of cosmic-ray hits were carried out with standard MIDAS routines.
The low-resolution OSN spectra (R ≈ 1400) were acquired using Albireo spectrograph centred on Hα wavelength (6562.8 Å) whereas NOT spectrum was obtained with the Andalucía Faint Object Spectrograph and Camera (ALFOSC)2, using Grism 7, with a dispersion of 1.5 Å/pixel, and 05–1″ slits. The reduction of this data set was performed using standard procedures within IRAF3, including bias subtraction, removal of pixel-to-pixel sensitivity variations, optimal spectral extraction, and wavelength calibration based on arc-lamp spectra.
All spectroscopic data were normalized with a spline fit to continuum and corrected to the barycenter after the wavelength calibration. The full width at half maximum (FWHM) and EW measurements of Hα lines were acquired by fitting Gaussian functions to the emission profiles using the ALICE subroutine of MIDAS.
2.2. Optical/IR photometric observations
As a part of our monitoring campaign the optical counterpart toXTE J1946+274 has been observed in the optical and infrared bands during the period of 2011 September−2014 November (see Table 3) with the 80-cm IAC80 and the 1.5-m TCS telescopes at the Observatorio del Teide on Tenerife (Spain) respectively. We obtained the optical photometric CCD images using B and V filters with integration time of 120 s. In infrared, J, H and Ks simultaneous observations were performed using the CAIN camera with integration times of 150 s. The reduction of the data was done by using the pipelines of both telescopes based on the standard aperture photometry (Camero et al. 2014, for more details on reduction).
The main part of the long-term optical CCD observations of the source include the 0.45-m reflecting ROTSEIIId4 telescope data achieved from 2005 April to 2012 November (MJD 53 465−56 215). ROTSEIIId telescope, located at the TÜBİTAK National Observatory (Antalya, Turkey), operates without filters is equipped with a 2048 × 2048 pixel CCD. For a total field of view (FOV) 1 85 × 185, the pixel scale is defined as 33 pixel-1 (Akerlof et al. 2003). During the observations, a total of 2014 CCD frames were collected covering almost 8 seasons. Dark and flat-field corrections of all images were done automatically by a pipeline immediately after the pointing. Instrumental magnitudes of all the corrected images were obtained using an aperture of 3 pixels (10 arcsec) in diameter by SExtractor Package (Bertin & Arnouts 1996). By comparing all the stars in each frames with USNO-A2.0 catalog R-band magnitudes, calibrated ROTSEIIId magnitudes were acquired. For the timing analysis the time series were corrected to the barycenter by using JPL DE200 ephemerides (Kızıloǧlu et al. 2005, for the details of ROTSEIIId data reduction).
2.3. X-ray observations
The Chandra X-ray Observatory observed XTE J1946+274 with the Advanced CCD Imaging Spectrometer (ACIS) instrument in FAINT mode in 2013 March 12 (MJD 56 363.115) for a total exposure time of 4.6 ks. Figure 1 and Table 1 provide the log of this observation. We used a 1/8 subarray, which provides a time resolution of 0.4 s, and the typical ACIS-S imaging and spectral configurations. The source was positioned in the back-illuminated ACIS-S3 CCD at the nominal target position. Standard processing of the data was performed by the Chandra X-ray Center (CXC) to Level 1 and Level 2 (processing software DS ver. 8.5.1.1). In this work we have used CIAO software (ver. 4.6) for the reprocessing and the analysis of the data. Since 2008, the Gamma-ray Burst Monitor (GBM) on board the Fermi satellite, has been monitoringXTE J1946+274. In this study we used timing products provided by the GBM Pulsar Team (see e.g. Finger et al. 2009; Camero-Arranz et al. 2010a, for a detailed description of the timing technique). We also used quick-look X-ray results provided by the RXTE All Sky Monitor team5, and Swift/BAT transient monitor results provided by the Swift/BAT team (Krimm et al. 2013).
 |
Fig. 2 Optical/IR and X-ray evolution of XTE J1946+274. The time bin for the ROTSEIIId lightcurve is 30 days and for Swift/BAT is 8 days. |
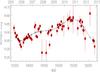 |
Fig. 3 Complete ROTSEIIId light curve binned using 30 days bins. Overplotted is the fitted sinusoid to the data (see Sect. 3 for more details). |
 |
Fig. 4 Hα line profile evolution during the X-ray quiescence. The presence of any remarkable variation is not detected. |
3. Analysis and results
3.1. Optical/IR photometry
The results of our multiwavelength campaign are shown in Fig. 2. In this figure the optical/IR behavior of the Be star is displayed, together with the X-ray activity observed from the NS (see Table 3). The ROTSE magnitude (fourth panel, from top to bottom) steadily varied from 2005 to 2013, with a minimum in 2006 and a maximum around mid 2010. A main X-ray outburst was then detected in 2010 lasting ~60 days and reaching a flux of ~140 mCrab in the 15−50 keV energy range (see bottom panel of Fig 2). The following four outbursts were seen in a series, typical to Type I outbursts, with a separation of ~60−90 days. In contrast to the other BeXRB systems showing recurrent series of normal outbursts, they did not coincide with the time of periastron passage of the NS. After the 2010/2011 X-ray outburst series, the Be/X-ray binary XTE J1946+274 did not show any transient activity. The quiescent phase has been ongoing for ~4 yr, although the optical/IR magnitudes have been showing an increasing trend since 2012 (see second and third panels of the same figure).
In order to search for periodic variability in the daily ROTSE light curve we used the Lomb-Scargle (Scargle 1982) and Clean (Roberts et al. 1987) algorithms. The frequency analysis was applied to all photometric data, including 1747 points, over a range from 0 to 17.49 d-1 (Nyquist frequency). We did not find any periodic variation in the original data, except for the power at the frequency of 1 d-1, as a result of the daily observing schedule. We then rebinned the light curve in 30 days bins. Figure 3 reveals a quasi-sinusoidal pattern in the data, with a minimum at the beginning of 2006 (MJD ~ 53 700). This seems to indicate that a brightening phase of the Be star occurred for almost five years, followed by a quick decline in about 2 yr. To clarify this point we used the Fourier analysis module included in the Period04 software package6 (Lenz & Breger 2005), which is based on a discrete Fourier transform algorithm. We thus fitted a sinusoid to a combination of the observed frequency 3.3(8) × 10-4 d-1 (~3030 d), found by Period04, together with its first and second harmonics. The uncertainties in the frequency determinations were computed from Monte Carlo simulations. The resulted fitted curve (see also Fig. 3) shows the probable evolution of the Be star brightening episode, probably a mass ejection event.
3.2. Hα line
In Fig. 4, we present the spectroscopic tracing of the Hα line profiles observed between 2012−2014. The Hα line was always seen in a single-peaked emission (as the one in 2007 July 18) whereas EW and FWHM measurements showed significant variations (see top panel of Fig. 2). The first spectroscopic observation of this period had the lowest value of Hα emission line, ~18 Å, ever observed for XTE J1946+274. The weakness of this emission comparing to the typical values of XTE J1946+274 might be interpreted as the variations in the decretion disk of the Be star. Assuming that the EW measurement of Hα line emission was also related to the amount of the material in the emitting region of the disk, the weakness of the EW would be the result of the mass loss either through the accretion of the NS or the truncation of its size despite the lack of an X-ray activity. It is also possible that the weakest value we caught does not represent the lowest one, instead it can be a part of the refilling process of the disk after a disk-loss episode. In fact, a sharp increasing trend of the EW right after this value confirms the suggested idea. The increase in EW lasted about three months reaching its peak value of ~48 Å. It is also important to note that this is the highest EW value of XTE J1946+274 ever observed. Although the line measurements were scattered between MJD 56 069−56 209, they were not significantly different than the average EW value.
During the observations of October and December 2013, the widest emissions were detected while EW values were around the average (see top panel of Fig. 2). In general the Hα line was seen as a narrow single-peaked emission with an average FWHM value of ~10.5 Å. It is also important to note that the EW and FWHM values of the source show an inverse relation despite the expected positive relation (Hanuschik 1989).
In addition, we computed the rotational velocity of the Be star. First we estimated the projected rotational velocity of XTE J1946+274 as vsini ~ 323 km s-1 via the average values of EW and FWHM parameters (Hanuschik 1989). Then using the inclination angle of the system given by Wilson et al. (2003), the true rotational velocity, vrot, of the Be star was measured as 323−449 km s-1. Taking the mass of the star as 16 M⊙ and 8 R⊙ as the limit radius for a B type star, then the critical break-up velocity, vcrit, was found to be ~618 km s-1. Thus, we find the critical fraction, defined as the the ratio of the equatorial rotational velocity to the the break-up velocity, of XTE J1946+274 as w ~ 0.5−0.72. This result indicates that the Be star in XTE J1946+274 is rotating at 50−70% of its break-up velocity, typical to the stars for the same type.
4. Chandra/ACIS-S X-ray analysis during quiescence
4.1. Imaging
We extracted an image in the 0.3−10 keV energy range, using the Chandra pointing observation from 2013 as described in Sect. 2.3. We then applied the CIAO celldetect tool to the ~4.6 ks ACIS-S cleaned image and foundXTE J1946+274 at  and
and  (J2000) with a signal-to-noise ratio of 11.025, and a statistical error of 0.03 arcsec radius. In addition, another X-ray bright star was detected at
  and
and  with a signal-to-noise ratio of 5.2, and a statistical error of 0.1 arcsec radius.
Furthermore, XTE J1946+274 is the 2MASS 19453935+2721555 star with a catalog position of α = 19h45m39s.36 and  (J2000) (statistical error of 0.06 arcsec radius) and the second star is the 2MASS 19453491+2718183 with a catalog position of
  and
and  (0.06 arcsec error radius). We then performed a boresight correction of the field to refineXTE J1946+274 position and its error circle. Assuming a physical association between the 2MASS stars and the X-ray sources, the final position ofXTE J1946+274 is
  and
and  with a 1σ associated error circle of 0.2 arcsec radius (computed doing a quadratic mean of all the positional and statistical errors plus the 2MASS catalogue intrinsic systematic errors).
4.2. Spectral study
To obtain the 0.3−10 keV phase-averaged spectrum for the Chandra ACIS-S observation we used source and background photons extracted as described in Sect. 2. We used the specextract script, which uses a combination of CIAO tools, to extract source and background spectra forXTE J1946+274. To extract only the photons from the point source a circular region with 25 radius and a circular background region of radii 18″ (far from the source) were used. For the present analysis we used the XSPEC package (version 12.8.1g; Arnaud 1996).
Two models provided the best fit to the data, an absorbed power law (PL) and blackbody (BB) models. For the photoelectric absorption we used the cross-sections from Balucinska-Church & McCammon (1992) and the Solar abundance from Anders & Grevesse (1989). The best-fit parameters for these models can be seen in Table 4. The main parameters for both models are Γ = 0.9 ± 0.4 (C-stat = 108.32 for 148 d.o.f.), and kT = 1.43 ± 0.17 keV (C-stat = 109.15 for 148 d.o.f.), with NH ~ 2−7 × 1022 cm-2. The 2−10 keV observed flux was FX = 0.75(3)−0.97(2) × 10-12 erg cm-2 s-1 for the BB and PL models, respectively. The photon index is similar to the value found with Swift/XRT (Müller et al. 2012) in the 1.5−7 keV energy range (Γ = 0.84(8)), and Suzaku-XIS in the 0.3−10 keV band (Γ = 1.09(5)). However, the X-ray flux level of XTE J1946+274 in those observations was about 2 order of magnitude larger (~2 × 10⁻¹⁰ erg cm-2 s-1).
Spectral parameters from an absorbed PL model and absorbed BB.
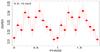 |
Fig. 5 Background subtracted X-ray pulse profile (in counts s-1) for XTE J1946+274 during quiescence in the 0.3−10 keV energy band. |
 |
Fig. 6 Background subtracted X-ray pulse profiles (in counts/s) during quiescence in different energy bands. |
 |
Fig. 7 Top: spin frequency history of XTE J1946+274 since its discovery in 1988. Middle: long-term optical light curve of this source. Bottom: long-term X-ray bolometric luminosity, and overplotted the evolution of the EW of the Hα line (red stars, open square, and filled circles). The Hα EW measurements from 1999 to 2002 were extracted from (Verrecchia et al. 2002, red crosses) and Wilson et al. (2003, red triangles). To compute the X-ray bolometric luminosity we follow the procedure by Wilson et al. (2003). |
4.3. Timing
For the timing analysis, we first referred the arrival time of each photon to the barycenter of the solar system using the CIAO tool axbary. Then, we used the dmextract tool to create background-subtracted lightcurves, using the time resolution of the data (~0.4 s). For this, we extracted the source photons on each individual observation from a circular region with 25 radius, and another one for the background, far from the source.
We searched for pulsations using the Xronos package and found a Ppulse = 15.757(1) s (epoch= MJD 56 363.115; ν = 0.063464(4) Hz). Figure 5 shows the pulse profile obtained by folding the X-ray data set using this period. Despite the low luminosity level of the source in this observation, we can observe a profile with two peaks separated by a dip at phase ~0.4, and another dip at phase 0.95. Wilson et al. (2003) found that at its lowest intensity level during the 2001 outburst the profile consisted of an asymmetric structured main peak near phase 0.2 in an RXTE/PCA observation of XTE J1946+274. We note, however, that this profile was obtained in the 2−30 keV energy range. In our Chandra/ACIS-S observation the dip in the pulse profile was more prominent at low energies in the 0.3−1.5 keV band, vanishing as the energy increases (see Fig. 6), and with the pulse profile evolving to single-peaked. The shape of the profile at 3−4.5 keV was narrower and quite symmetric comparing to the asymmetric single peaks found at 1.5−3.5 keV and 4.5−10 keV, with all peaking at different phases of ~0.2, ~0.4, and ~0.6 for each energy band.
The modulation amplitude of the 0.3−10 keV pulse displayed in Fig. 5 (12 phase bins) can be measured using a pulse fraction defined as follows,  (1)where n is the number of phase bins per cycle, yi is the number of counts in the ith phase bin, σi is the error on yi and
  is the mean number of counts in the cycle. Applying this formula to our data we obtained a PFrms = 32.1(3)%. Using the standard definition,
  (2)the value we obtained was larger, as expected, being 56(20)%. In addition, we found PFrms estimates of 51.02(12)%, 18.52(2)%, 54.27(13)%, and 37.23(15)% in the 0.3−1.5 keV, 1.5−3 keV, 3−4.5 keV, and 4.5−10 keV energy bands, respectively. We would like to note that for the profiles at different energy bands the phase binning was reduced to 8, since the PFrms formulation did not yield real solutions in some of the bands.
5. Discussion
5.1. Be/NS interaction
XTE J1946+274 is one of the BeXRBs that spends most of its time in an X-ray quiescent phase. The uniqueness of the system comes from its X-ray outburst behavior that is not connected to the orbital passages of the NS. The shifts in the outburst phases with respect to the periastron/apastron passages of the NS is thought to be result of the global perturbations triggered by the truncation of the disk radius. During quiescent state we have not seen any trace of such density wave in the decretion disk that shows itself as the variation of the emission profiles in the spectroscopic data. Wilson et al. (2003) attributed the variations in the Hα emission profile to the existence of the perturbations in the disk and added the difficulties of detection of the density perturbations in XTE J1946+274 since the relatively small viewing angle restricts the size of the projected area to be observed. According to that, only the large-scaled perturbations can be seen in the disk of XTE J1946+274. In contrast to this idea, Silaj et al. (2010) suggested that emission line profile shapes could not be used to estimate the inclination angle of the system since for a given inclination angle different types of profile shapes might be produced as a result of the density changes in the disk-thermal structure. This means that, in the suggested picture of Wilson et al. (2003) for XTE J1946+274, we should have seen the profile changes if there had occurred any density variations in the decretion disk, despite the small inclination angle of the system. Therefore it is very likely not to see any profile changes in the emission lines.
Be stars are variable on all time scales. Short-term variability is commonly associated with either the rotation of the star and/or non-radial pulsations (see e.g. Kızıloǧlu et al. 2007; Gutiérrez-Soto et al. 2011), while the long-term variability is believe to be originated by structural changes in the Be decretion disk. The typical time scale for the formation and disintegration of the disk has been found to coincide with the observed time scales of the largest amplitude variations (Lyuty & Zaitseva 2000; Camero et al. 2014). The observed long optical brightening experienced by XTE J1946+274 may be interpreted as a slow mass ejection event, which started in 2006, peaked in 2010 and rapidly decreased afterwards, reaching a quiescence level in 2012.
The high values obtained for the Hα EW, with the line always seen in emission, may indicate that a large Be circumstellar disk is permanently present in this system. It is also worth noting that although renewed X-ray activity was not observed until 2010, the EW value of the Hα line was already −37.35 Å in 2007 July (see Table 2). It is possible that the decretion disk of the Be star in XTE J1946+ 274 is tilted with respect to the orbital motion of the NS. In such a misaligned system warping of the differentially rotating disk can trigger the X-ray activity when the NS capture material from this area (see Okazaki et al. 2013). The 2010 X-ray outbursts series emptied accumulated material in the warped regions and the disk dramatically decreased around 2011 (see bottom panel of Fig. 7). Although the recovery of the decretion disk was fast, our data point out that the disk reached its maximum size by the time the mass ejection event was over. In such a stable environment the disk did not get warped and therefore no X-rays were detected. This seems to be confirmed by the absence of any variations in our Hα line profiles during the same period.
The ongoing optical/IR brightening, probably initiated around mid 2012, resembles so far the previous mass ejection event between 2006−2012. If the phenomenon repeats we foresee that approximately in two years XTE J1946+274 will manifest in X-rays.
5.2. NS behavior
XTE J1946+274 displayed an extended period of activity from 1998 September to 2001 July. Wilson et al. (2003) noted that this period of activity resembled a series of normal outbursts (thirteen) more than a single giant outburst. After approximately 9 yr in quiescence, XTE J1946+274 reawakened in X-rays with a series of five outbursts between 2010 and 2011 (but less intense than in 1998). Once again, two outbursts were observed per orbital period, which did not clearly coincide with the times of periastron and apastron passages of the NS. Fermi/GBM detected pulsations from XTE J1946+274 between 2010 and 2011 (see top panel of Fig. 7).
The last frequency measurement reported by GBM was 0.0635228(3) Hz (Pspin = 15.74238(2) s) in 2011. Although the frequency histories were not orbitally corrected, and therefore a strong orbital modulation is contaminating the intrinsic torque variations, considering our frequency determination of 2013, the source might have spun down at a rate close to  Hz s-1 (Ṗ ~ 2.4 × 10⁻¹⁰ s s-1). Spin-up torque/flux correlations for this source were found by Wilson et al. (2003), suggesting the presence of an accretion disk around the NS during X-ray active periods. This scenario is corroborated by Fermi/GBM during the 2010/2011 X-ray outbursts (see Fig. 7).
To determine whether the observed X-ray turn-off was due to centrifugal inhibition of accretion or not (Stella et al. 1986), Wilson et al. (2003) estimated the flux at the onset of this effect by equating the magnetospheric radius and the corotation radius, obtaining a threshold flux for the onset of the centrifugal inhibition of accretion in the range of 0.6−6.0 × 10⁻¹¹ erg cm-2 s-1. Our observed flux during quiescence in 2013 was well below this range (~0.1 × 10⁻¹¹ erg cm-2 s-1), corresponding to an X-ray luminosity of ~1.2 × 1034 erg s-1 in the 0.3−10 keV range. We would like to point out that the transition flux level depends on several factors (see Eq. (17) in Wilson et al. 2003), although the authors only considered the uncertainty of one of them (the constant factor k; see also Eq. (9) in Wilson et al. 2003). To compute a good estimate of the transition flux error it is not an easy task, mainly because there is a considerable uncertainty in the NS parameters. For instance, recent NS mass measurements in X-ray/optical binaries give a range of M = [1.037,2.44] M⊙ (mean value 1.568 M⊙; Lattimer 2012). In addition, Cipolleta et al. (2015) equation of state (EOS) predicts a range of values for the NS radius of 7.64−18.86 km. In particular, Sharmaet al. (2015) found in their model that for a NS of 1.5 M⊙ the predicted radius should be of the order of 11.67 km. Having this in mind and assuming an error on the NS parameters of about 20%, we would obtain a lower limit for the transitional flux ~0.12 × 10⁻¹¹ erg-2 s-1, in agreement with the quiescent flux observed by Chandra considering the uncertainties. The flux lower limit would drop with higher errors on the NS parameters. Therefore, the compact object on XTE J1946+274 might have not been in centrifugal inhibition of accretion in 2013 but close to enter in that regimen.
Based on our observation of XTE J1946+274 during quiescence in 2013, and assuming that the source enters the supersonic propeller regime (see e.g. Davies & Pringle 1981; Henrichs 1983), it is expected to spin down at a rate of  , where μ is the NS magnetic moment, M the mass (1.4 M⊙), I the moment of inertia, cs is the sound speed at the magnetospheric radius (which we take here of the order of the free-fall velocity), and rA is the Alfvén radius (Henrichs 1983). With this
  found to be t−0.13 ×10⁻¹² Hz s-1. We note, however, that there is no general consensus on the estimate of the propeller efficiency, and the difference on the estimate of the torque during supersonic propeller state may be as large as t104 under certain conditions (see discussion for LS I+61°303 in Papitto et al. 2012). It is also possible that other types of torques might be operating simultaneously with the propeller-type torque, e.g. the “frictional” torque (Ghosh 1995, and references therein), with the effect of increasing the observed spin-down torque on the NS. On the other hand, the X-ray luminosity in supersonic propeller regimen is given by
  (Henrichs 1982), where Ṁ is the mass accretion rate, and vrel is the relative velocity which is typically of the order of ~1000 km s-1. For XTE J1946+274 this yields to LXt1.13 × 1034 erg s-1, which is close to what was observed in 2013 (~1.19 × 1034 erg s-1). Moreover, we found that this is also true for the long quiescence period between 2001 and 2010. The observed spin-down rate from MJD 55 353.01 to 52 115.70, computed using the last frequency determination by Wilson et al. (2003) in 2001 (~0.0635 Hz) and the first one detected by GBM (~0.063421 Hz) in 2010, gives
  Hz s-1. This result is also close to the observed spin-down rate during this particular period.
6. Summary and conclusions
We have performed a long-term multiwavelength study of the Be/X-ray binary system XTE J1946+274, a source which spends almost all its time in quiescence. Our findings include the detection of a large Be circumstellar disk during that phase. We address the absence of major X-ray activity by discussing our results in terms of the neutron star Be-disk interaction.
-
A long mass ejection event from the Be-star commenced in 2006,attained its maximum intensity in 2010, and reached quiescencepresumably in 2012.
-
The high values obtained for the Hα EW (always in emission) point to the permanently presence of a large Be circumstellar disk, probably tilted with respect to the orbital motion of the NS.
-
We proposed that the mechanism that might be triggering the X-ray activity is the contact of the NS with the warped area of the Be disk. After the series of X-ray episodes, the warped regions emptied and the disk dramatically decreased.
-
There was an absence of variations in the Hα line profiles during the posterior fast recovery of the disk. This took place in parallel to the decay of the optical mass ejection event. In a much more stable environment the disk did not get warped and therefore no X-rays were detected.
-
On the other hand, pulsations from the NS have been detected during X-ray quiescence in 2013, with Ppulse = 15.757(1) s and an rms pulse fraction of 32.1(3)%.
-
The 0.3−10 keV X-ray spectrum of the NS was well fitted with either an absorbed black-body or absorbed power-law models (kT = 1.43 ± 0.17 and Γ = 0.9 ± 0.4).
-
The observed X-ray luminosity during quiescence is close to that observed when the NS is in supersonic propeller regimen.
-
The ongoing optical/IR brightening resembles so far the previous mass ejection event. If the proposed scenario from above is valid we predict that approximately in two years XTE J1946+274 will show major X-ray activity.
The data presented here were obtained (in part) with ALFOSC, which is provided by the Instituto de Astrofísica de Andalucía (IAA) under a joint agreement with the University of Copenhagen and NOTSA.
IRAF is distributed by the National Optical Astronomy Observatory, optical images which is operated by the Association of Universities for Research in Astronomy (AURA) under cooperative agreement with the National Science Foundation.
The Robotic Optical Transient Search Experiment, ROTSE, is a collaboration of Lawrence Livermore National Lab, Los Alamos National Lab, and the University of Michigan (http://www.ROTSE.net).
Acknowledgments
We thank the anonymous referee for his/her helpful comments and suggestions. This article is partially based on service observations made with the IAC80 and TCS telescopes operated on the island of Tenerife by the Instituto de Astrofísica de Canarias (IAC) in the Spanish Observatorio del Teide. The present work is also based on observations made with the Nordic Optical Telescope, operated by the Nordic Optical Telescope Scientific Association at the Observatorio del Roque de los Muchachos (IAC), La Palma, Spain. The Albireo spectrograph at the 1.5-m telescope is operated by the Instituto de Astrofísica de Andalucía at the Sierra Nevada Observatory. We thank TÜBİTAK and ROTSE collaboration for partial support in using the RTT 150 and ROTSEIIId Telescopes with project numbers TUG-RTT150.08.45, 12ARTT150-264-1 and ROTSE-40. The scientific results reported in this article are based in part on data obtained from the Chandra Data Archive. The work of J.G.S. is supported by the Spanish Programa Nacional de Astronomía y Astrofísica under contract AYA2012-39246-C02-01. E.N. acknowledges a VALi+d postdoctoral grant from the Generalitat Valenciana and was supported by the Spanish Ministry of Economy and Competitiveness under contract AYA 2010-18352. A.C. was supported by the AYA2012-39303, SGR2009-811 and iLINK2011-0303 grants. M.Ö. A. acknowledges support from TÜBİTAK, The Scientific and Technological Research Council of Turkey, through the research project 106T040. We thank the anonymous refree for his/her helplful comments dans suggestions.
References
- Akerlof, C. W., Kehoe, R. L., McKay, T. A., et al. 2003, PASP, 115, 132 [NASA ADS] [CrossRef] [Google Scholar]
- Anders, E., & Grevesse, N. 1989, Geochim. Cosmochim. Acta, 53, 197 [Google Scholar]
- Arnaud, K. A. 1996, in Astronomical Data Analysis Software and Systems V, eds. G. H. Jacoby & J. Barnes, ASP Conf. Ser., 101, 17 [Google Scholar]
- Balucinska-Church, M., & McCammon, D. 1992, ApJ, 400, 699 [NASA ADS] [CrossRef] [Google Scholar]
- Bertin, E., & Arnouts, S. 1996, A&AS, 117, 393 [NASA ADS] [CrossRef] [EDP Sciences] [Google Scholar]
- Caballero, I., Pottschmidt, K., Bozzo, E., et al. 2010, ATel, 2692, 1 [NASA ADS] [Google Scholar]
- Camero, A., Zurita, C., Gutierrez Soto, J., et al. 2014, A&A, 568, A115 [NASA ADS] [CrossRef] [EDP Sciences] [Google Scholar]
- Camero-Arranz, A., Finger, M. H., Ikhsanov, N. R., Wilson-Hodge, C. A., & Beklen, E. 2010a, ApJ, 708, 1500 [NASA ADS] [CrossRef] [Google Scholar]
- Camero-Arranz, A., Finger, M. H., Wilson-Hodge, C., & Jenke, P. 2010b, ATel, 2677, 1 [NASA ADS] [Google Scholar]
- Campana, S., Israel, G., & Stella, L. 1999, A&A, 352, L91 [NASA ADS] [Google Scholar]
- Cipolleta, F., Cherubini, C., Filippi, S., Rueda, J. A., Ruffini, R. 2015, Phys. Rev. D 92, 023007 [Google Scholar]
- Davies, R. E., & Pringle, J. E. 1981, MNRAS, 196, 209 [NASA ADS] [CrossRef] [Google Scholar]
- Finger, M. H., Beklen, E., Narayana Bhat, P., et al. 2009, Fermi Symp., eConf Proc. C091122 [Google Scholar]
- Ghosh, P. 1995, JA&A, 16, 289 [NASA ADS] [Google Scholar]
- Gutiérrez-Soto, J., Reig, P., Fabregat, J., & Fox-Machado, L. 2011, in IAU Symp. 272, I eds. C. Neiner, G. Wade, G. Meynet, & G. Peters, 505 [Google Scholar]
- Hanuschik, R. W. 1989, Ap&SS, 161, 61 [NASA ADS] [CrossRef] [Google Scholar]
- Heindl, W. A., Coburn, W., Gruber, D. E., et al. 2001, ApJ, 563, L35 [NASA ADS] [CrossRef] [Google Scholar]
- Henrichs, H. F. 1982, Ph.D. Thesis, University of Amsterdam [Google Scholar]
- Henrichs, H. F. 1983, in Accretion-Driven Stellar X-ray Sources, eds. W. H. G. Lewin, & E. P. J. van den Heuvel, 393 [Google Scholar]
- Illarionov, A. F., & Kompaneets, D. A. 1990, MNRAS, 247, 219 [NASA ADS] [Google Scholar]
- Kızıloǧlu, Ü., Kızıloǧlu, N., & Baykal, A. 2005, AJ, 130, 2766 [NASA ADS] [CrossRef] [Google Scholar]
- Kızıloǧlu, U., Kızıloǧlu, N., Baykal, A., Yerli, S. K., & Özbey, M. 2007, A&A, 470, 1023 [NASA ADS] [CrossRef] [EDP Sciences] [Google Scholar]
- Krimm, H. A., Barthelmy, S. D., Baumgartner, W., et al. 2010, ATel, 2663, 1 [NASA ADS] [Google Scholar]
- Krimm, H. A., Holland, S. T., Corbet, R. H. D., et al. 2013, ApJS, 209, 14 [NASA ADS] [CrossRef] [Google Scholar]
- Lattimer, J. M., 2012, ARNPS, 62, 485 [Google Scholar]
- Lenz, P., & Breger, M. 2005, Comm. Asteroseism., 146, 53 [Google Scholar]
- Lyuty, V. M., & Zaitseva, G. V. 2000, VizieR Online Data Catalog: J/PAZh/26/13 [Google Scholar]
- Müller, S., Kühnel, M., Caballero, I., et al. 2012, A&A, 546, A125 [NASA ADS] [CrossRef] [EDP Sciences] [Google Scholar]
- Müller, S., Kühnel, M., Pottschmidt, K., et al. 2010, ATel, 3077, 1 [NASA ADS] [Google Scholar]
- Nakajima, M., Mihara, T., Nakagawa, Y. E., et al. 2010, ATel, 3048, 1 [NASA ADS] [Google Scholar]
- Okazaki, A. T., Hayasaki, K., & Moritani, Y. 2013, PASJ, 65, 41 [NASA ADS] [Google Scholar]
- Papitto, A., Torres, D. F., & Rea, N. 2012, ApJ, 756, 188 [NASA ADS] [CrossRef] [Google Scholar]
- Priedhorsky, W. C., & Holt, S. S. 1987, Space Sci. Rev., 45, 291 [NASA ADS] [CrossRef] [Google Scholar]
- Roberts, D. H., Lehar, J., & Dreher, J. W. 1987, AJ, 93, 968 [NASA ADS] [CrossRef] [Google Scholar]
- Scargle, J. D. 1982, ApJ, 263, 835 [NASA ADS] [CrossRef] [Google Scholar]
- Sharma, B. K., Centelles, M., Vinas, X., Baldo, M., Burgio, G. F. 2015, A&A, in press, DOI: 10.1051/0004-6361/201526642 [Google Scholar]
- Silaj, J., Jones, C. E., Tycner, C., Sigut, T. A. A., & Smith, A. D. 2010, ApJS, 187, 228 [NASA ADS] [CrossRef] [Google Scholar]
- Smith, D. A., & Takeshima, T. 1998, ATel, 36, 1 [NASA ADS] [Google Scholar]
- Stella, L., White, N. E., & Rosner, R. 1986, ApJ, 308, 669 [NASA ADS] [CrossRef] [Google Scholar]
- Verrecchia, F., Israel, G. L., Negueruela, I., et al. 2002, A&A, 393, 983 [NASA ADS] [CrossRef] [EDP Sciences] [Google Scholar]
- Wilson, C. A., Finger, M. H., Wilson, R. B., & Scott, D. M. 1998, IAU Circ., 7014, 2 [NASA ADS] [Google Scholar]
- Wilson, C. A., Finger, M. H., Coe, M. J., & Negueruela, I. 2003, ApJ, 584, 996 [NASA ADS] [CrossRef] [Google Scholar]
All Tables
Optical and IR magnitudes of XTE J1946+274 observed with IAC80 and TCS telescopes respectively.
All Figures
|
Fig. 1 Swift/BAT light-curve (15−50 keV) with a bin size equal to 10 d. Tick marks on the segments located above the light-curve denote the times of the Chandra pointing observation (light blue), as well as the optical/IR photometric data from the ground-based telescopes ROTSEIIId (black), IAC80 (dark blue) and TCS (dark red). The optical spectroscopic observations come from OSN (dark red), NOT (blue) and RTT150 (light red; see also Table 2). |
| In the text | |
|
Fig. 2 Optical/IR and X-ray evolution of XTE J1946+274. The time bin for the ROTSEIIId lightcurve is 30 days and for Swift/BAT is 8 days. |
| In the text | |
|
Fig. 3 Complete ROTSEIIId light curve binned using 30 days bins. Overplotted is the fitted sinusoid to the data (see Sect. 3 for more details). |
| In the text | |
|
Fig. 4 Hα line profile evolution during the X-ray quiescence. The presence of any remarkable variation is not detected. |
| In the text | |
|
Fig. 5 Background subtracted X-ray pulse profile (in counts s-1) for XTE J1946+274 during quiescence in the 0.3−10 keV energy band. |
| In the text | |
|
Fig. 6 Background subtracted X-ray pulse profiles (in counts/s) during quiescence in different energy bands. |
| In the text | |
|
Fig. 7 Top: spin frequency history of XTE J1946+274 since its discovery in 1988. Middle: long-term optical light curve of this source. Bottom: long-term X-ray bolometric luminosity, and overplotted the evolution of the EW of the Hα line (red stars, open square, and filled circles). The Hα EW measurements from 1999 to 2002 were extracted from (Verrecchia et al. 2002, red crosses) and Wilson et al. (2003, red triangles). To compute the X-ray bolometric luminosity we follow the procedure by Wilson et al. (2003). |
| In the text | |
Current usage metrics show cumulative count of Article Views (full-text article views including HTML views, PDF and ePub downloads, according to the available data) and Abstracts Views on Vision4Press platform.
Data correspond to usage on the plateform after 2015. The current usage metrics is available 48-96 hours after online publication and is updated daily on week days.
Initial download of the metrics may take a while.