Fig. 9
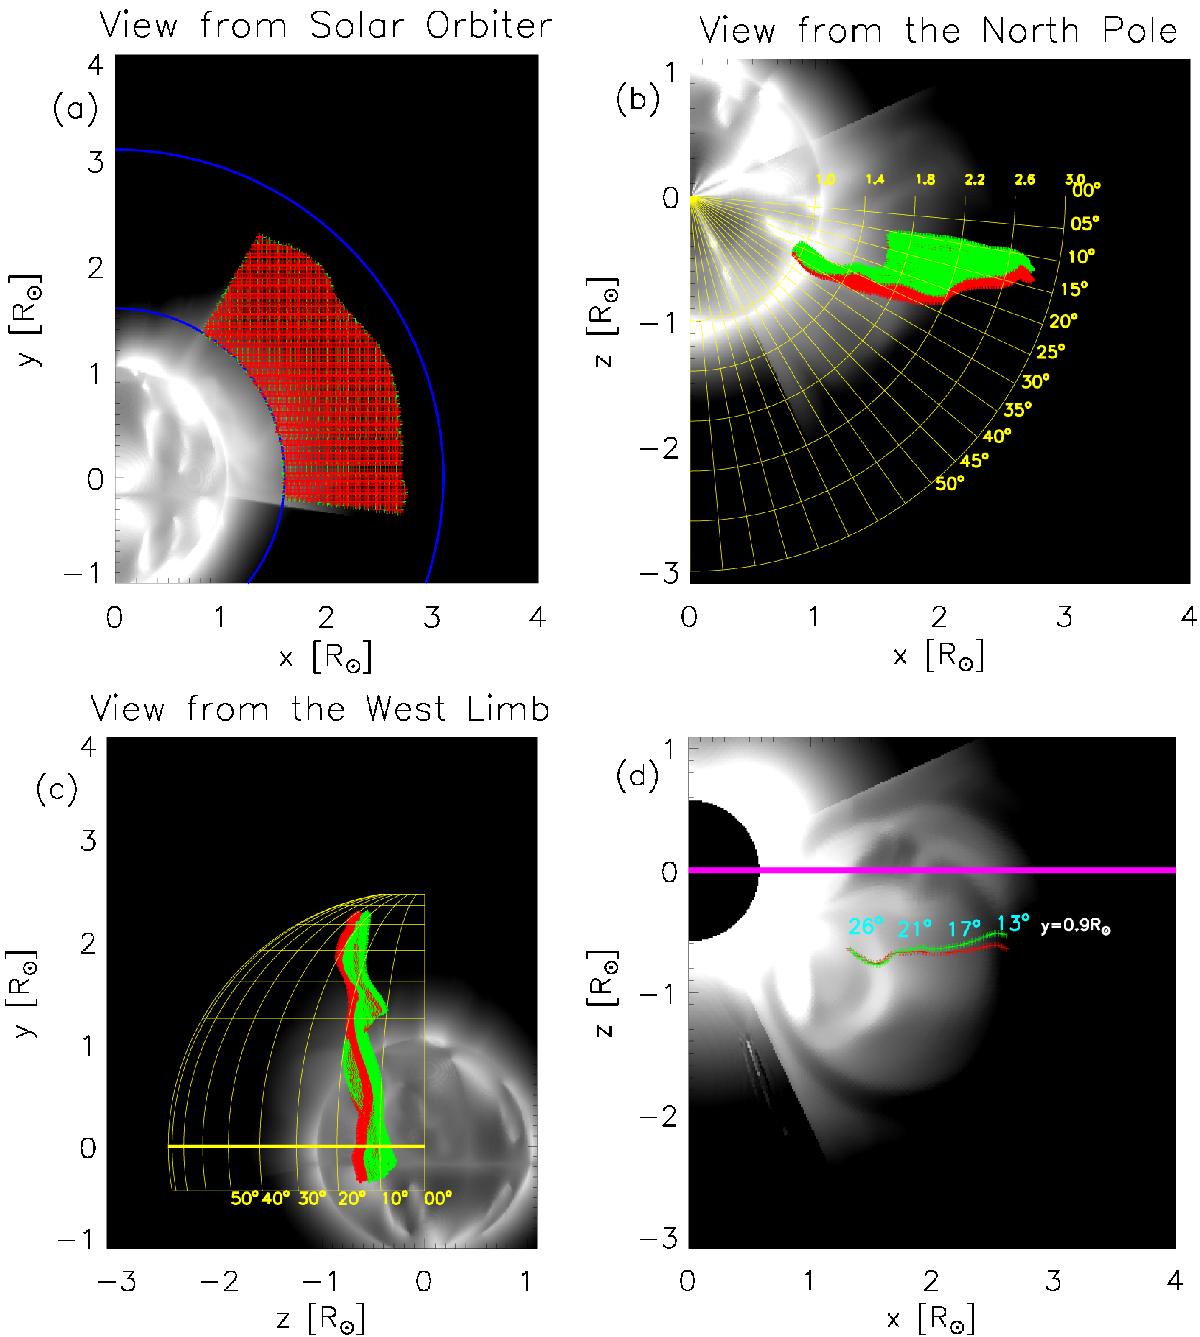
Maps of Log10 of column density (range between 10-15 g/cm2 and 10-12 g/cm2) seen from three different points of view; superimposed is the cloud of points inferred from the polarization ratio technique (red crosses) and the cloud of point computed from Eq. (12) (green crosses) projected onto the plane of sky: a) point of view parallel to direction z and (x,y) coordinates of clouds of points; b) point of view parallel to direction y and (x,z) coordinates of clouds of points; c) point of view parallel to direction x and (z,y) coordinates of clouds of points. d) Maps of white-light emission seen from a point of view parallel to the y direction; superimposed is a subset of points from the two clouds at y = 0.9 R⊙. In light blue we give the angle with the plane of sky for some of the points. The thick magenta line marks the plane of sky.
Current usage metrics show cumulative count of Article Views (full-text article views including HTML views, PDF and ePub downloads, according to the available data) and Abstracts Views on Vision4Press platform.
Data correspond to usage on the plateform after 2015. The current usage metrics is available 48-96 hours after online publication and is updated daily on week days.
Initial download of the metrics may take a while.