Free Access
Fig. 19
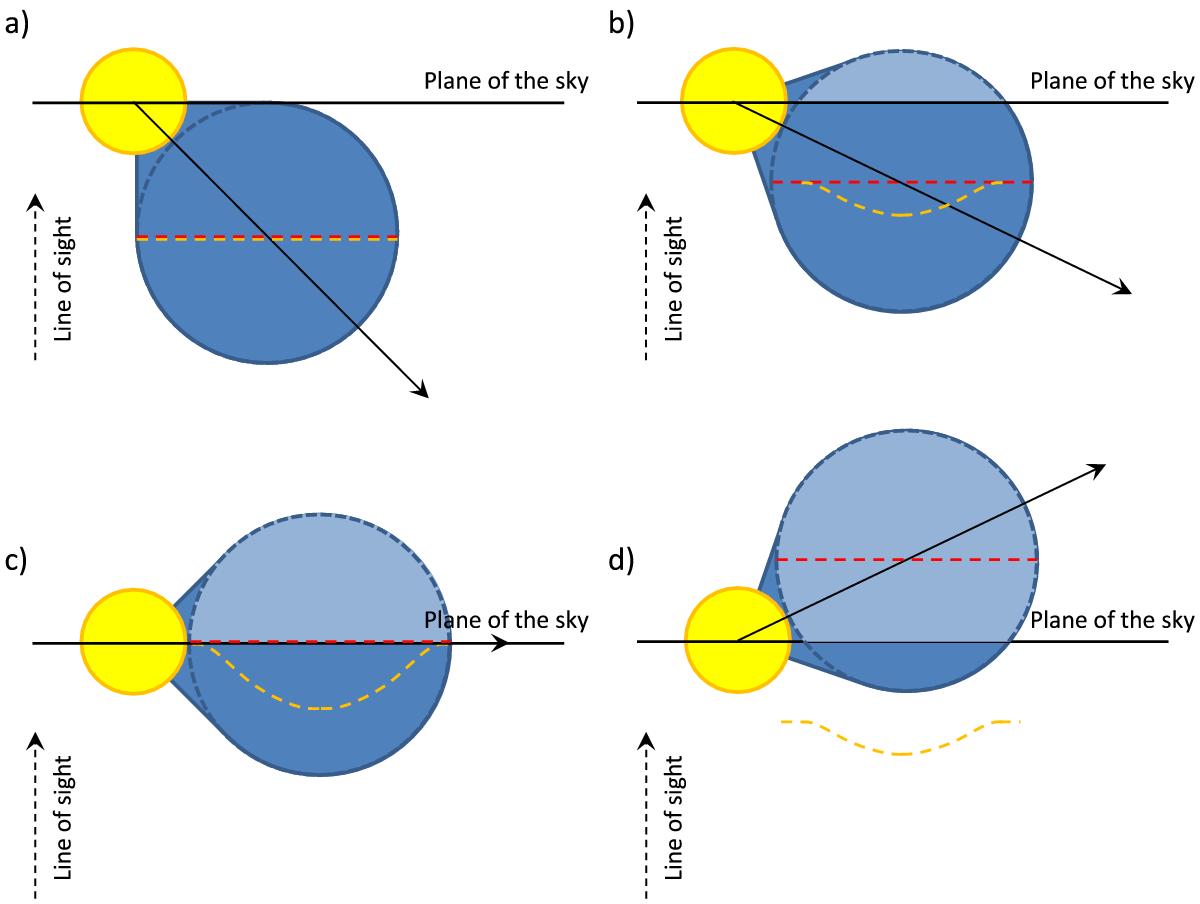
Idealized cartoon showing the location of the real centre of mass (red dashed line) and of the folded density centre of mass (orange dashed line) for different orientations of the CME with respect to the POS (see text).
Current usage metrics show cumulative count of Article Views (full-text article views including HTML views, PDF and ePub downloads, according to the available data) and Abstracts Views on Vision4Press platform.
Data correspond to usage on the plateform after 2015. The current usage metrics is available 48-96 hours after online publication and is updated daily on week days.
Initial download of the metrics may take a while.