Fig. 15
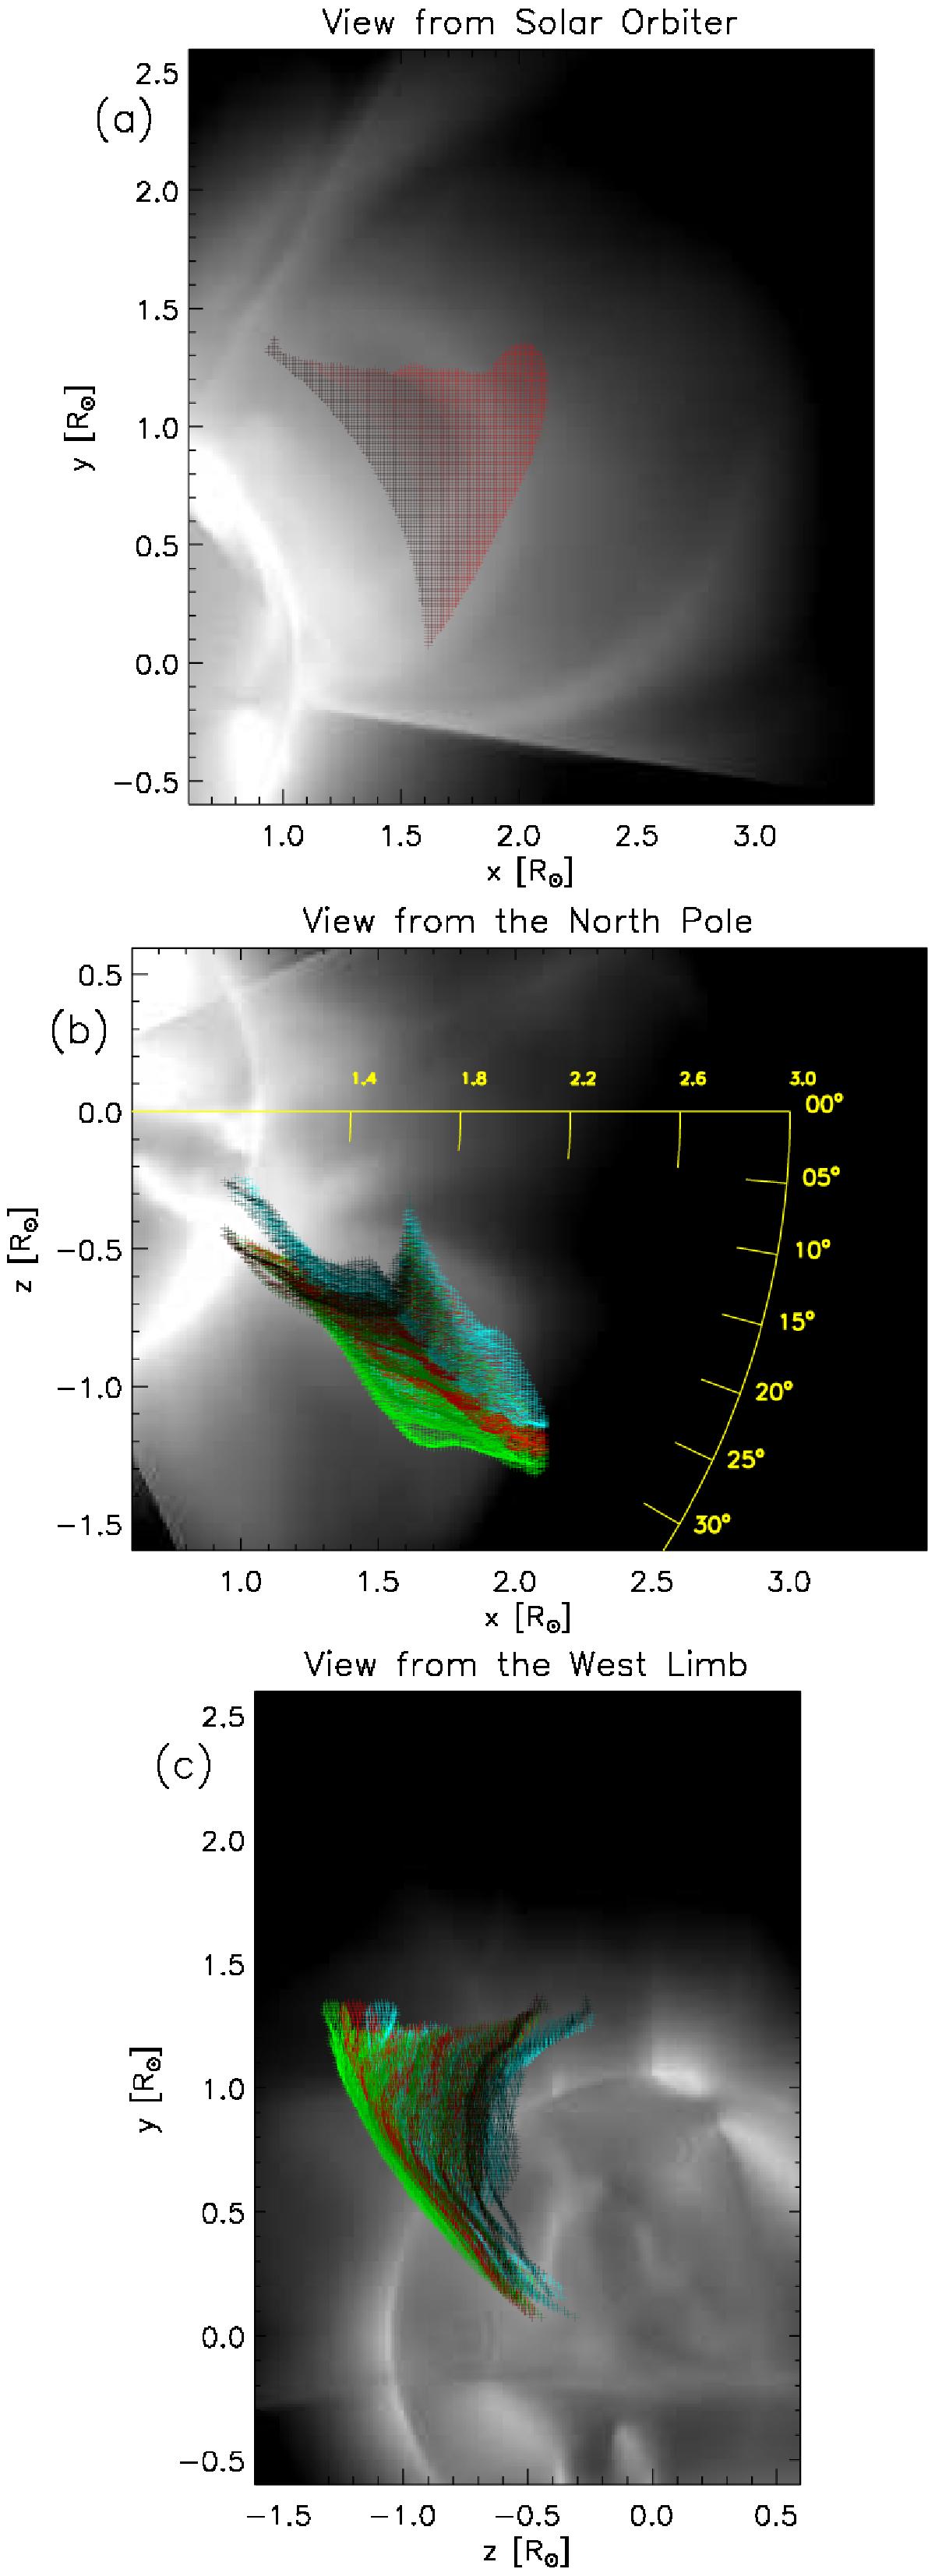
Maps of Log10 of column density (range between 10-15 g/cm2 and 10-12 g/cm2) seen from three different points of view; superimposed are the points of the clouds that belong to the CME. Points obtained from the polarization ratio technique are red, points of the folded centre of mass are green, and points of the centre of mass are light blue. a) Point of view parallel to direction z and (x,y) coordinates of clouds of points; b) point of view parallel to direction y and (x,z) coordinates of clouds of points; c) point of view parallel to direction x and (z,y) coordinates of clouds of points. A movie of these panels is available online.
Current usage metrics show cumulative count of Article Views (full-text article views including HTML views, PDF and ePub downloads, according to the available data) and Abstracts Views on Vision4Press platform.
Data correspond to usage on the plateform after 2015. The current usage metrics is available 48-96 hours after online publication and is updated daily on week days.
Initial download of the metrics may take a while.