Fig. 10
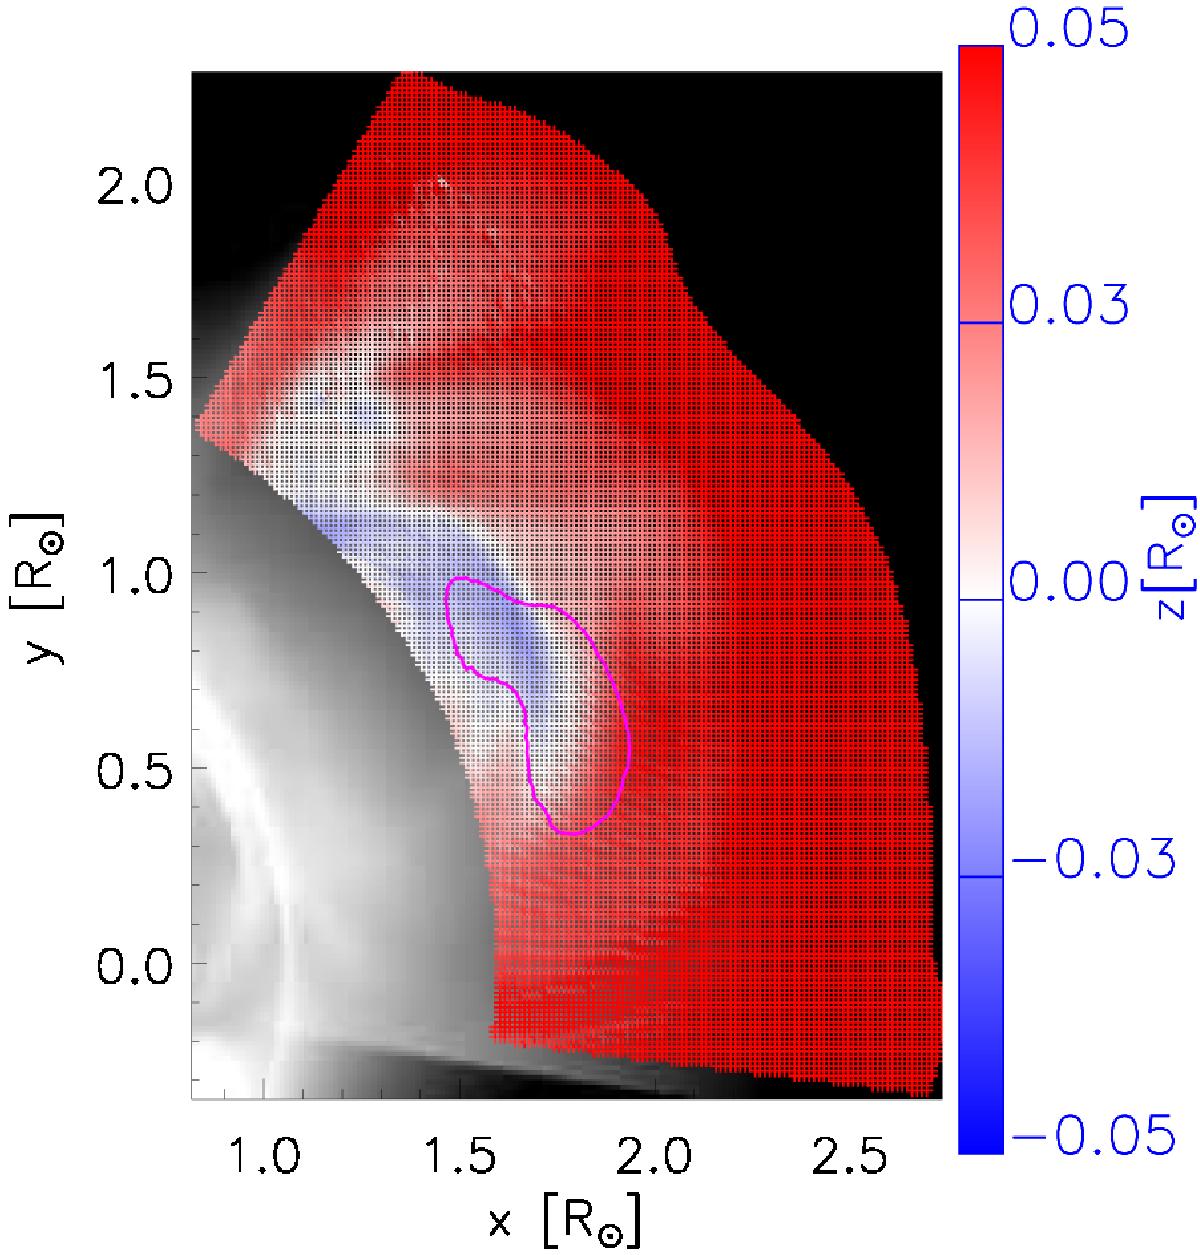
Map of differences of z coordinates in R⊙ for the two clouds of points, overplotted on a map of Log10 of column density as in Fig. 9a. Red regions correspond to where the distance from the plane of sky computed from the polarization ratio technique is overestimated and blue regions correspond to where it is underestimated. The magenta contour roughly identifies the flux rope position where the ratio between the y component of the magnetic field integrated along the LOS divided by the magnetic field intensity is above the arbitrary positive threshold of 0.4.
Current usage metrics show cumulative count of Article Views (full-text article views including HTML views, PDF and ePub downloads, according to the available data) and Abstracts Views on Vision4Press platform.
Data correspond to usage on the plateform after 2015. The current usage metrics is available 48-96 hours after online publication and is updated daily on week days.
Initial download of the metrics may take a while.