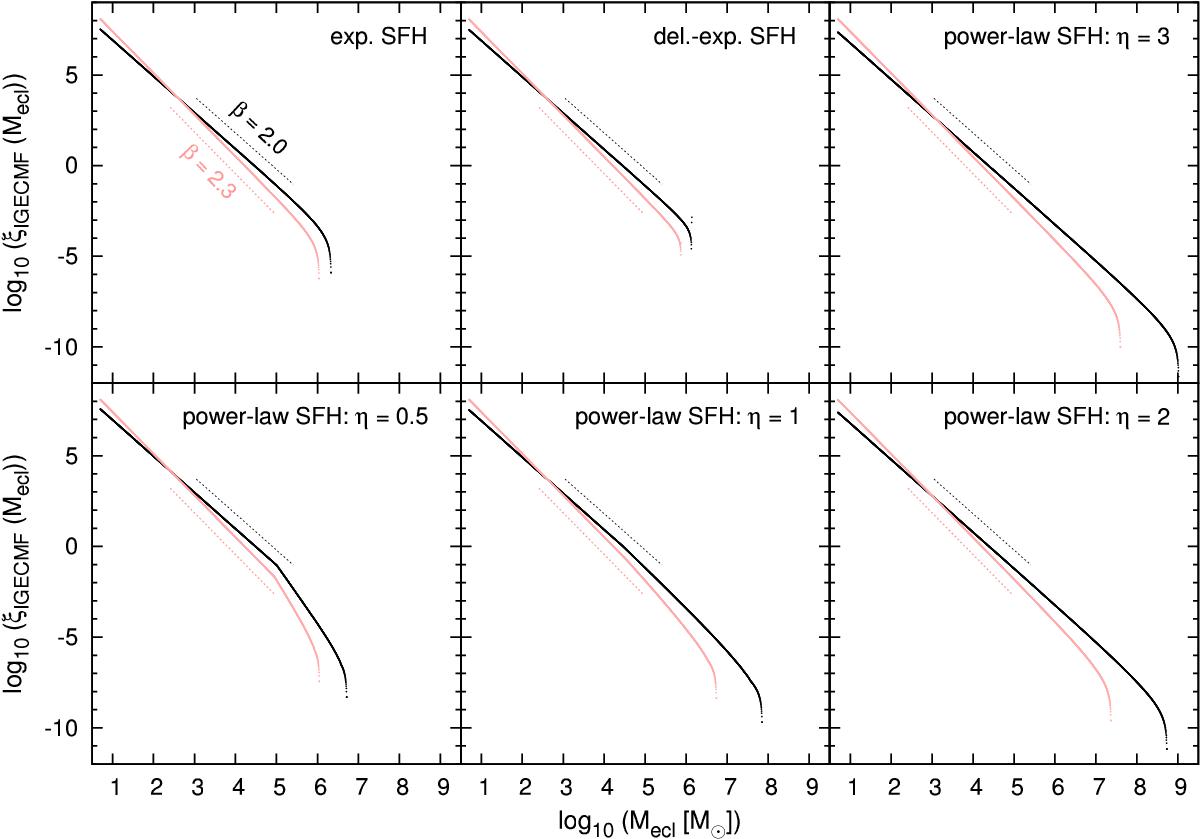
Fig. 9

IGECMFs for β = 2.0 (black) and β = 2.3 (red) showing the mass distribution function after a Hubble time of SC formation according to the SFH indicated in the corner of each panel. Strictly speaking, these IGECMFs represent how the birth stellar masses of SCs are distributed since evolutionary effects leading to a change in the SC mass are not taken into account. Shifted to higher or lower values, the dashed lines represent the underlying ECMFs in the same color for comparison. According to the underlying SFHs, the IGECMFs are arranged in the same manner as in Fig. 7. (A color version of this figure is available in the online journal.)
Current usage metrics show cumulative count of Article Views (full-text article views including HTML views, PDF and ePub downloads, according to the available data) and Abstracts Views on Vision4Press platform.
Data correspond to usage on the plateform after 2015. The current usage metrics is available 48-96 hours after online publication and is updated daily on week days.
Initial download of the metrics may take a while.


