Fig. 4
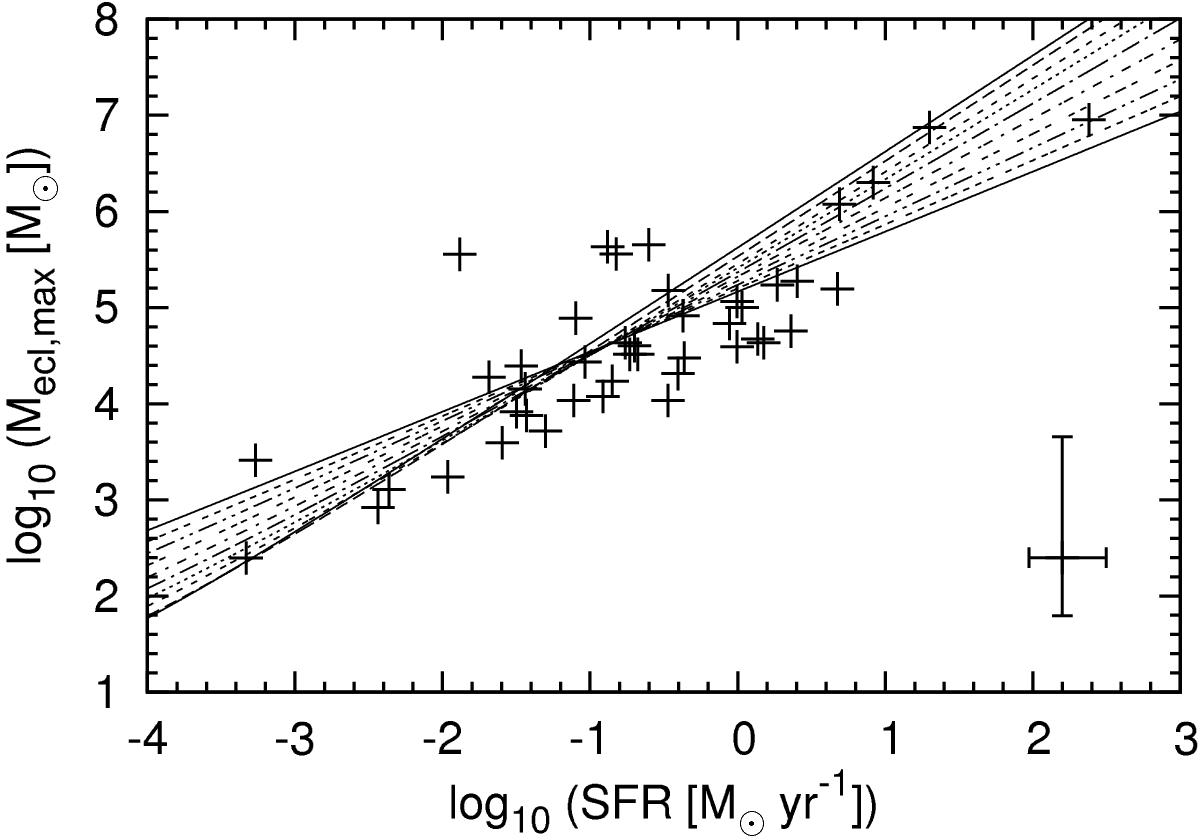
Mecl,max vs. galaxy-wide SFR (replotted from Weidner et al. 2004, including new data points). The curves are least-squares fits according to the SFR − Mecl,max relation (Eq. (25)) with the fitting parameter δt for all β between 1.5 (steepest curve) and 2.6 (shallowest curve) in steps of 0.1. The curves for β = 1.6, and 1.8 are omitted. A typical error estimate is indicated in the bottom right corner.
Current usage metrics show cumulative count of Article Views (full-text article views including HTML views, PDF and ePub downloads, according to the available data) and Abstracts Views on Vision4Press platform.
Data correspond to usage on the plateform after 2015. The current usage metrics is available 48-96 hours after online publication and is updated daily on week days.
Initial download of the metrics may take a while.