Fig. 10
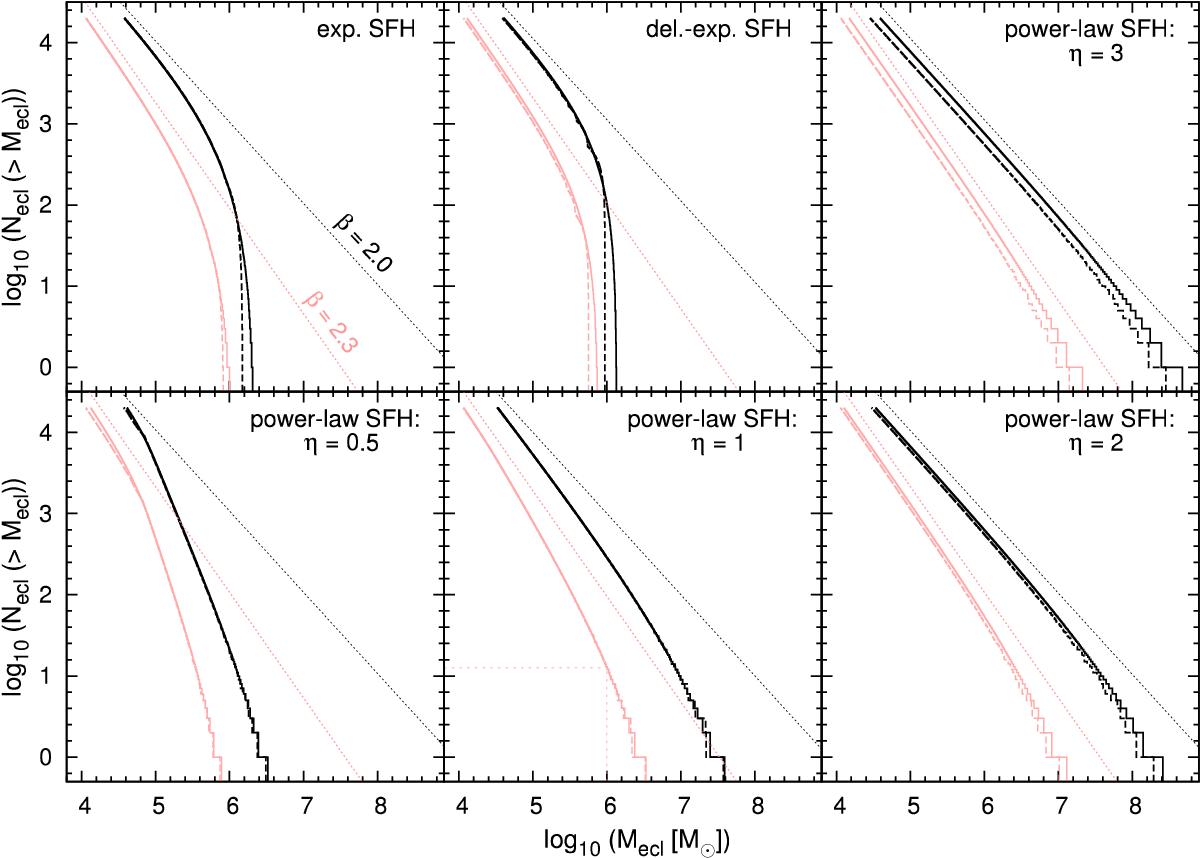
Cumulative mass distributions of the 20000 most massive SCs for the SFH as indicated in the top right corner of each panel, computed a) from the IGECMFs (continuous lines) and b) from the ECMF separately for SC formation epochs with the highest SFRs (dashed lines) for β = 2.0 (black) and β = 2.3 (red). Note the small deviations between method a) and b). For comparison, the dotted lines show the theoretical cumulative SC mass distributions for one single SC formation epoch with the same ECMF in the same color. To avoid overlaps, these lines are shifted to higher values. According to the underlying SFHs, the panels are arranged in the same manner as in Fig. 7. For instance, as indicated in the lower middle panel, there are in total about 101.1 ≈ 13 SCs above Mecl = 106M⊙. (A color version of this figure is available in the online journal.)
Current usage metrics show cumulative count of Article Views (full-text article views including HTML views, PDF and ePub downloads, according to the available data) and Abstracts Views on Vision4Press platform.
Data correspond to usage on the plateform after 2015. The current usage metrics is available 48-96 hours after online publication and is updated daily on week days.
Initial download of the metrics may take a while.