Free Access
Fig. 9
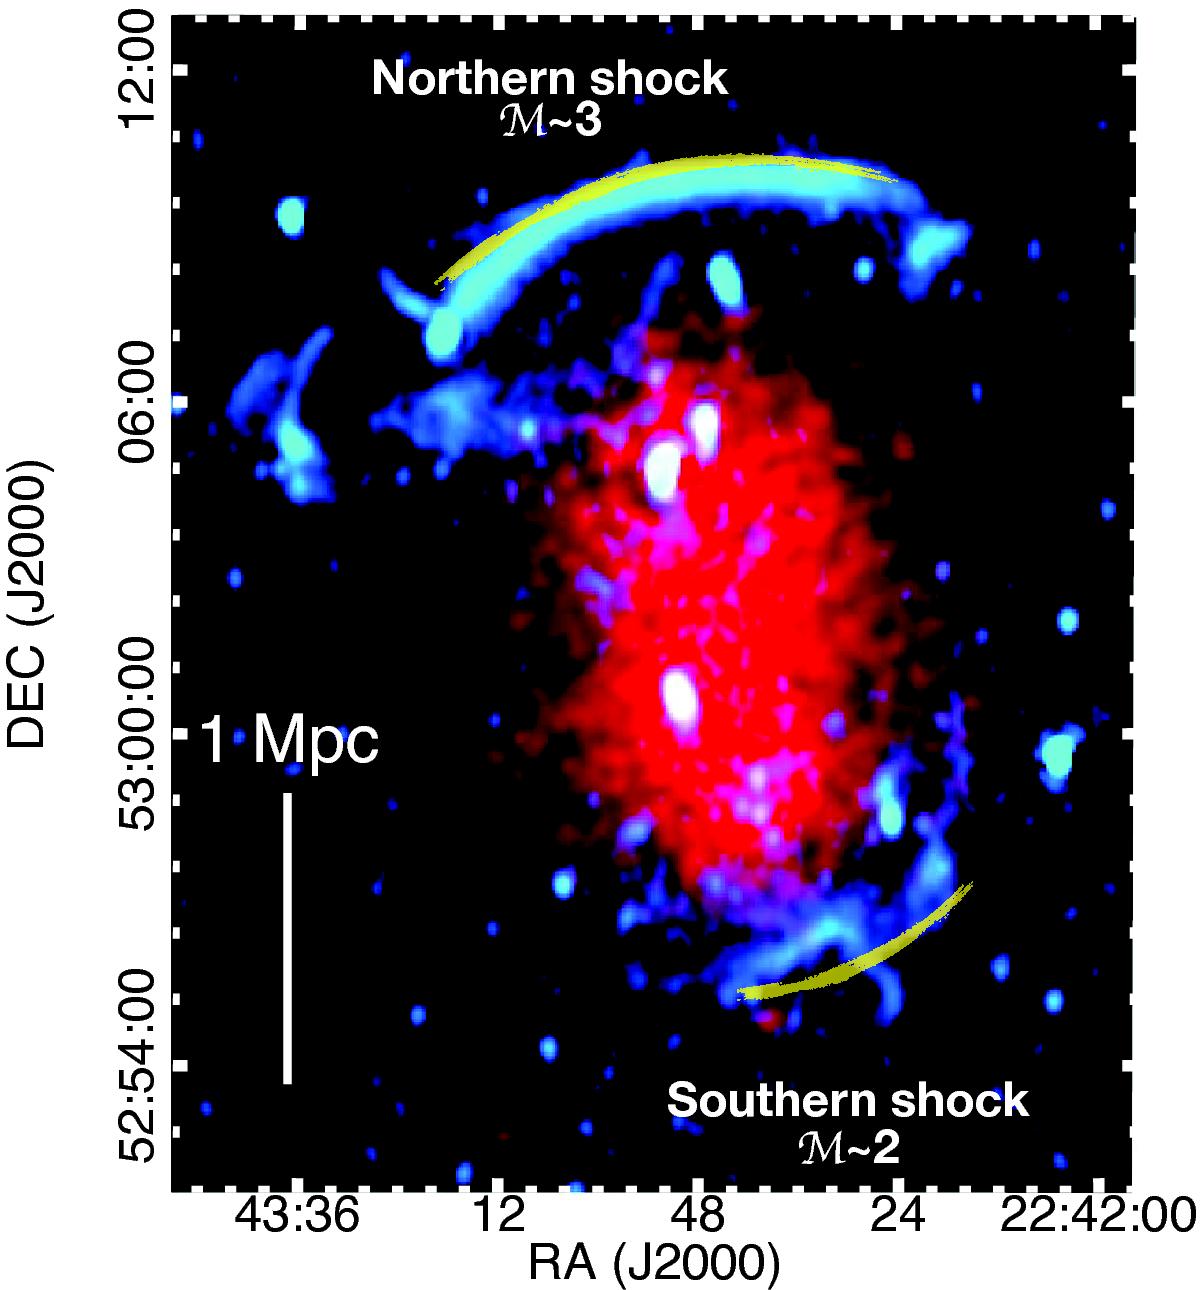
Smoothed 0.5−2.0 keV band X-ray image (red) and WSRT 1.4 GHz image of CIZA J2242.8+5301 (cyan). The thin yellow lines depict the approximate locations of the shock fronts confirmed by Suzaku.
Current usage metrics show cumulative count of Article Views (full-text article views including HTML views, PDF and ePub downloads, according to the available data) and Abstracts Views on Vision4Press platform.
Data correspond to usage on the plateform after 2015. The current usage metrics is available 48-96 hours after online publication and is updated daily on week days.
Initial download of the metrics may take a while.