Fig. 8
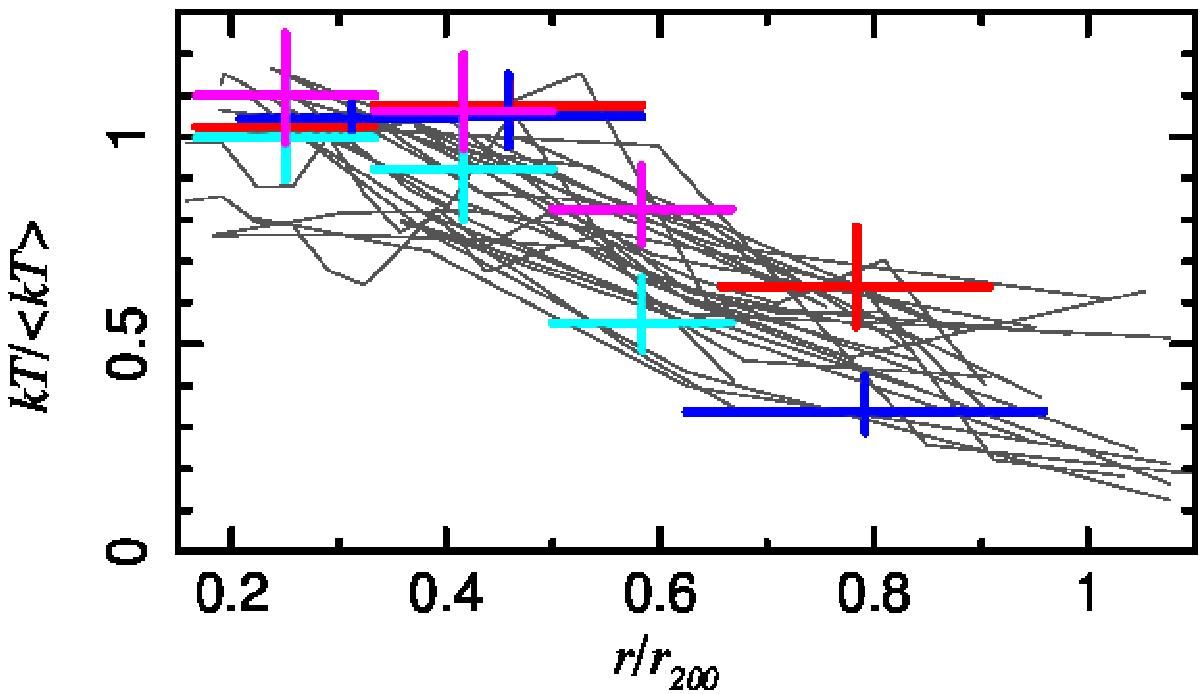
Scaled projected temperature profiles compared with relaxed clusters (gray: see Fig. 8 in Reiprich et al. 2013). The profiles were normalized to the average temperature. The r200 value was derived from Henry et al. (2009). Blue, red, yellow and magenta crosses show the temperature profile of the North, South, East and West direction, respectively.
Current usage metrics show cumulative count of Article Views (full-text article views including HTML views, PDF and ePub downloads, according to the available data) and Abstracts Views on Vision4Press platform.
Data correspond to usage on the plateform after 2015. The current usage metrics is available 48-96 hours after online publication and is updated daily on week days.
Initial download of the metrics may take a while.