Fig. 7
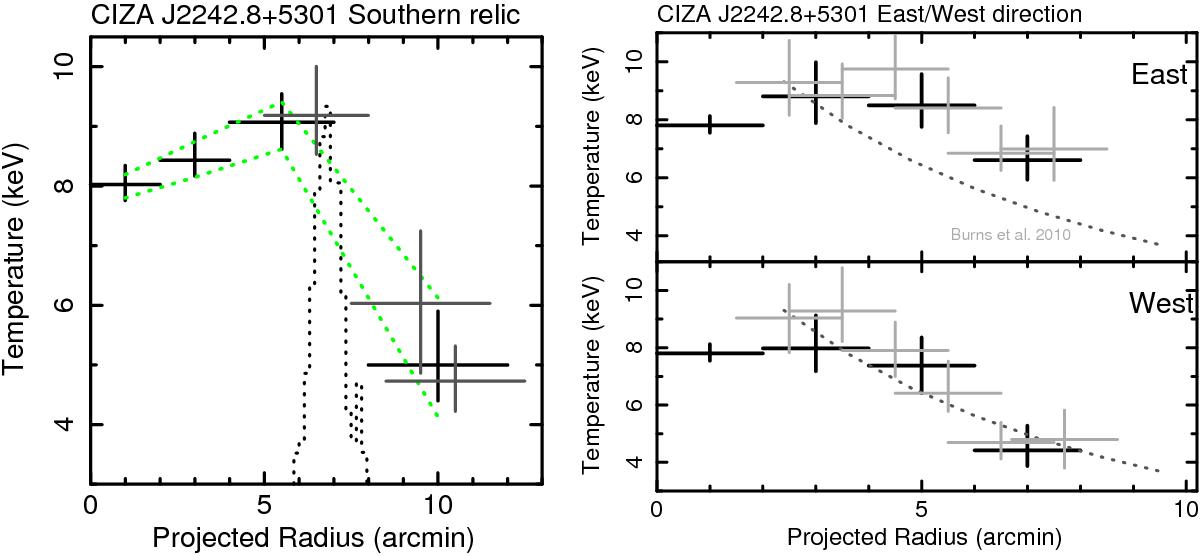
Radial profile of the ICM temperature for the south (left), east and west direction. The black crosses show the best-fitted values and the gray crosses show the results of slightly offset regions. The gray dotted curves in the right panels show the temperature profile Burns et al. (2010; see text). In the left panel, we removed the radio point sousrce located just behind the relic.
Current usage metrics show cumulative count of Article Views (full-text article views including HTML views, PDF and ePub downloads, according to the available data) and Abstracts Views on Vision4Press platform.
Data correspond to usage on the plateform after 2015. The current usage metrics is available 48-96 hours after online publication and is updated daily on week days.
Initial download of the metrics may take a while.